
The ODDFYIELD function in Excel returns the annual yield of a bond with a short or long first coupon period.
A coupon is an interest payment. When a bond’s issue date falls between scheduled payment dates, its first interest period differs from the regular periods that follow.
ODDFYIELD uses that first period, the purchase price, and the remaining bond terms to calculate yield. The result can differ from the bond’s stated coupon rate.
I’ll show you how to convert purchase costs into the required price and identify inputs that cause errors.
ODDFYIELD Function Syntax in Excel
Here is the syntax for ODDFYIELD:
=ODDFYIELD(settlement, maturity, issue, first_coupon, rate, pr, redemption, frequency, [basis])
- settlement (required): The date the buyer takes ownership of the bond.
- maturity (required): The date the bond’s principal is repaid.
- issue (required): The date the bond was issued.
- first_coupon (required): The first interest payment date.
- rate (required): The annual coupon rate, entered as a percentage.
- pr (required): The clean purchase price per $100 of face value, excluding accrued interest.
- redemption (required): The repayment amount per $100 of face value.
- frequency (required): Coupon payments per year. Use
1for annual,2for semiannual, or4for quarterly payments. - basis (optional): The day-count convention. Use
0for US 30/360,1for Actual/actual,2for Actual/360,3for Actual/365, or4for European 30/360. Omitted basis defaults to0.
Use actual Excel dates for the date arguments. Settlement must fall after issue and before the first coupon, with maturity after the first coupon.
The first coupon must also fit the payment schedule leading to maturity. A date that falls off that schedule can return #NUM!.
When to Use ODDFYIELD Function
- Calculate yield from a quoted price when a new bond has an irregular first interest period.
- Convert a purchase cost into a yield using the bond’s face value and payment terms.
- Compare yields across a watchlist containing short and long first coupon periods.
- Check how different purchase prices affect the yield of the same bond.
Example 1: Calculate a Short First-Period Yield
Let’s start with a new Bayshore Water Authority bond whose first interest period is shorter than its regular payment interval.
Below is the dataset. Column A labels the bond terms, column B holds the inputs, and the green Yield cell will hold the answer.
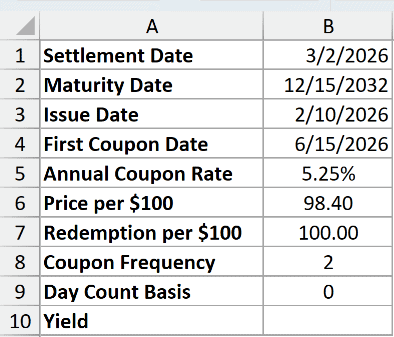
We want the annual yield implied by the bond’s purchase price and first coupon date.
Enter this formula in B10:
=ODDFYIELD(B1,B2,B3,B4,B5,B6,B7,B8,B9)
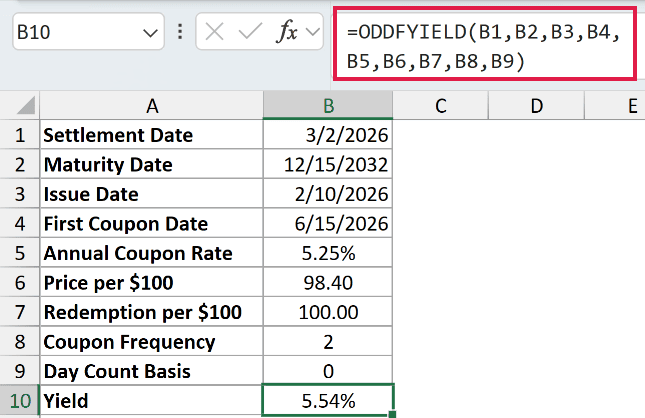
The formula returns 5.54%. The bond’s annual coupon rate is 5.25%, but its purchase price is 98.40, below its 100.00 redemption amount.
The issue date is 2/10/2026, settlement is 3/2/2026, and the first coupon is 6/15/2026. ODDFYIELD accounts for that shortened opening period.
Each argument points to its labelled input. The coupon rate goes into rate, while the quoted purchase price goes into pr.
Pro Tip: Format the ODDFYIELD result as a percentage. Keep the coupon rate and calculated yield clearly labelled, since they describe different things.
Example 2: Convert Purchase Cost Into Price
A dollar purchase cost needs converting before it can go into ODDFYIELD.
Below is the dataset for Granite Falls Electric. The card includes bond terms, face value purchased, purchase cost excluding accrued interest, and labelled calculation cells.
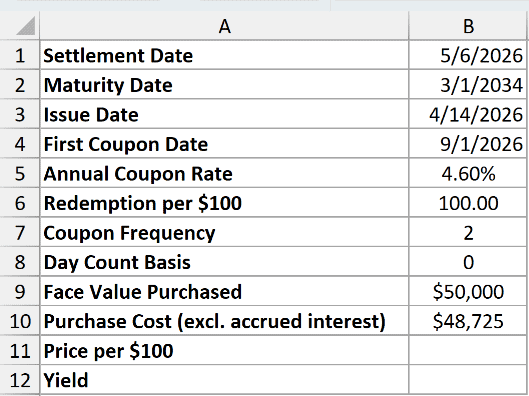
We want to calculate the yield on a $50,000 face-value holding purchased for $48,725, excluding accrued interest.
First, calculate the price per $100 in the white helper cell B11:
=B10/B9*100
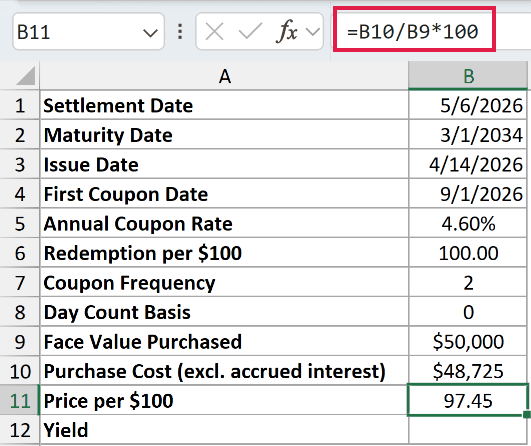
This divides purchase cost by face value and converts it to a quote per $100. The helper returns 97.45.
Now use that helper as the price argument in the green yield cell B12:
=ODDFYIELD(B1,B2,B3,B4,B5,B11,B6,B7,B8)
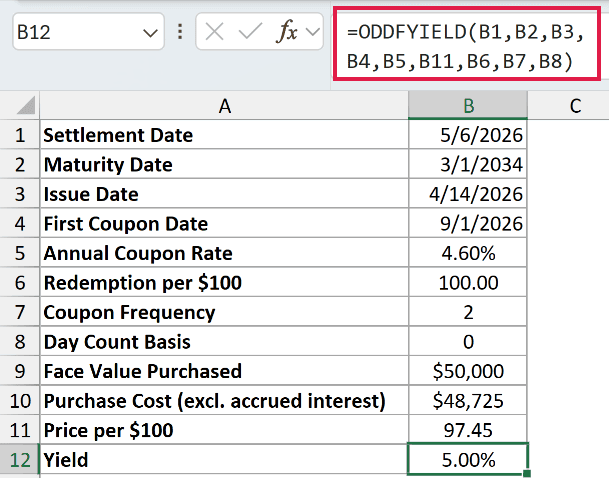
ODDFYIELD returns 5.00%, compared with the bond’s 4.60% annual coupon rate.
The white cell is an intermediate price calculation. The green cell contains the annual yield we’re looking for.
Pro Tip: Use the purchase cost excluding accrued interest for this conversion. Feeding the total dollar holding cost directly into pr uses the wrong units.
Example 3: Compare First Coupon Periods
Changing the issue date changes the first period, even when the remaining bond terms stay the same.
Below is the dataset for Willow Bend Hospital. Columns A:C describe the first periods and dates, while G:H holds shared inputs. Columns D:E will show yields.
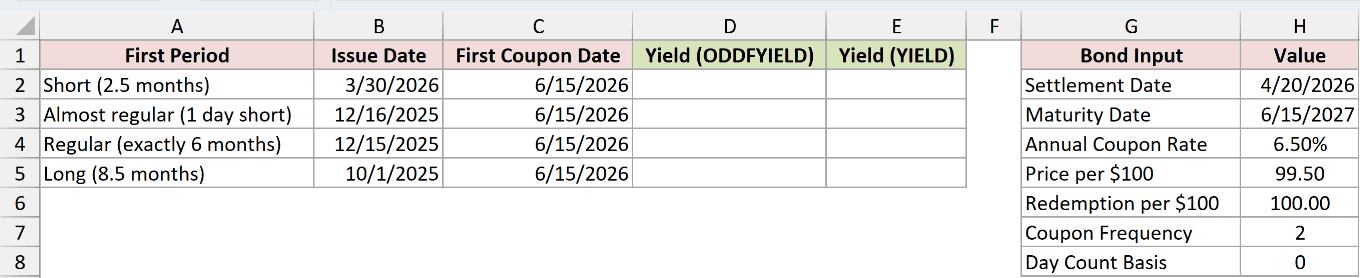
We want to compare short, almost regular, exactly regular, and long first periods.
Enter this formula in D2:
=ODDFYIELD($H$2,$H$3,+B2:B5,+C2:C5,$H$4,$H$5,$H$6,$H$7,$H$8)
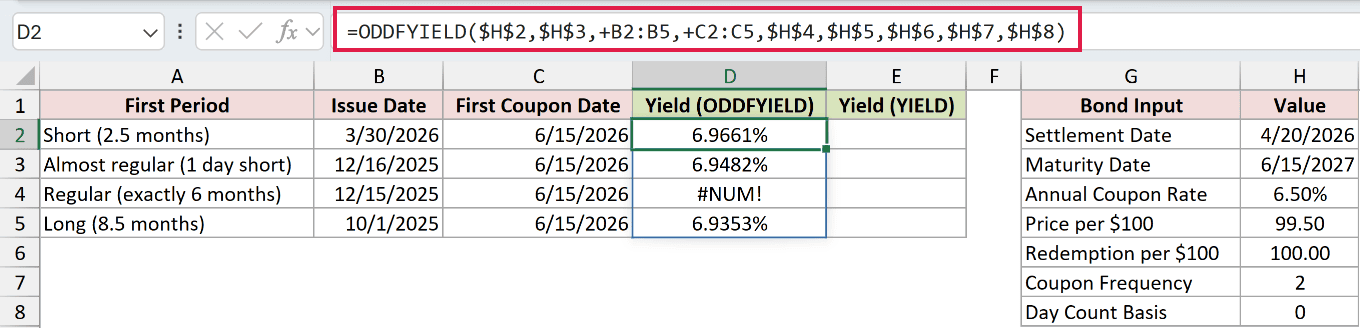
The + before each range makes Excel pass its values as an array. Without it, ODDFYIELD returns a single #VALUE! for a bare range argument.
The formula spills into D2:D5 in Excel 2021, Excel 2024, and Microsoft 365. In Excel 2019 and earlier, use individual row references and copy down.
The short period returns 6.9661%, the almost regular period returns 6.9482%, and the long period returns 6.9353%.
The exactly regular row deliberately returns #NUM! in D4. Its first period is exactly 6 months, so it isn’t an odd first period.
For comparison, YIELD calculates yield for a regular coupon schedule. It doesn’t take an issue date or first coupon date, so it cannot account for these opening-period differences.
Enter the comparison formula in E2 and copy it down through E5:
=YIELD($H$2,$H$3,$H$4,$H$5,$H$6,$H$7,$H$8)
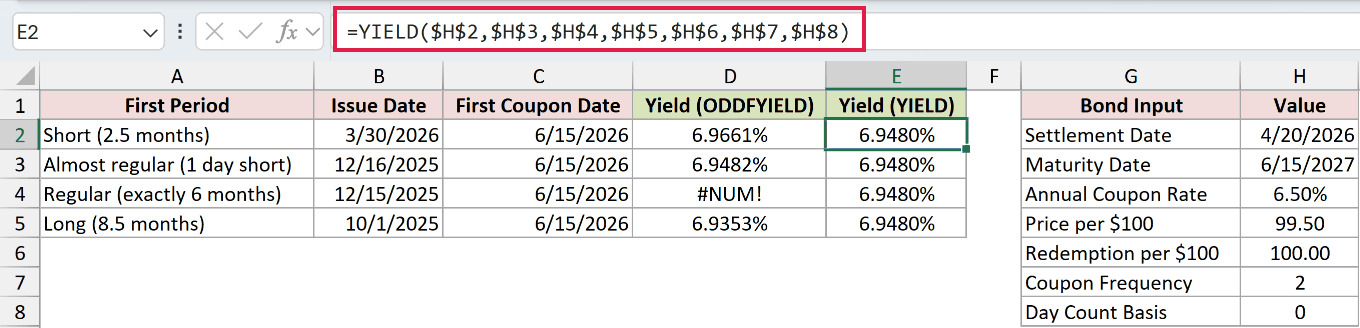
Every comparison row returns 6.9480%, because every reference points to the same shared input card. This column is copied down, rather than spilled.
YIELD is appropriate for the exactly regular row. Its other rows illustrate what happens when the calculation ignores the odd first period.
The almost regular row is 1 day short of a regular period. Its 6.9482% result is close to the comparison’s 6.9480%, but the exactly regular case still errors.
Example 4: Calculate a Bond Watchlist
Now let’s apply ODDFYIELD to several bonds with a shared settlement date.
Below is the dataset. Columns A:F contain bond names, dates, coupon rates, and prices. The I:J card holds shared trade settings, and column G will contain yields.

We want a yield for each bond using its own dates, coupon rate, and quoted price.
Enter this formula in G2:
=ODDFYIELD($J$2,+D2:D7,+B2:B7,+C2:C7,+E2:E7,+F2:F7,$J$3,$J$4,$J$5)

The results spill through G7. Each row uses the settlement date in J2, with redemption, frequency, and basis taken from the same settings card.
Notice that maturity comes before issue and first coupon in the formula. The worksheet’s column order doesn’t determine the function’s argument order.
Pinecrest Medical Center returns 5.19%, while Silver Creek Rail returns 4.67%. The list includes different opening-period lengths, so each bond needs its own issue date.
Oakmont School District returns 4.33%, Redstone Aerospace 5.55%, Clearwater Power Co-op 4.74%, and Meridian Port Authority 5.26%.
Example 5: See How Price Changes Yield
Keeping the bond terms fixed makes the relationship between price and yield easier to see.
Below is the dataset for Summit Valley Telecom. Column A contains trial prices, the D:E card holds fixed bond terms, and column B will show yields.
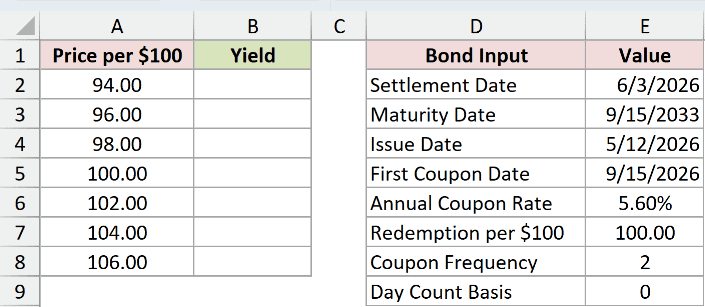
We want to calculate the yield at each purchase price without changing the coupon schedule.
Enter this formula in B2:
=ODDFYIELD($E$2,$E$3,$E$4,$E$5,$E$6,+A2:A8,$E$7,$E$8,$E$9)
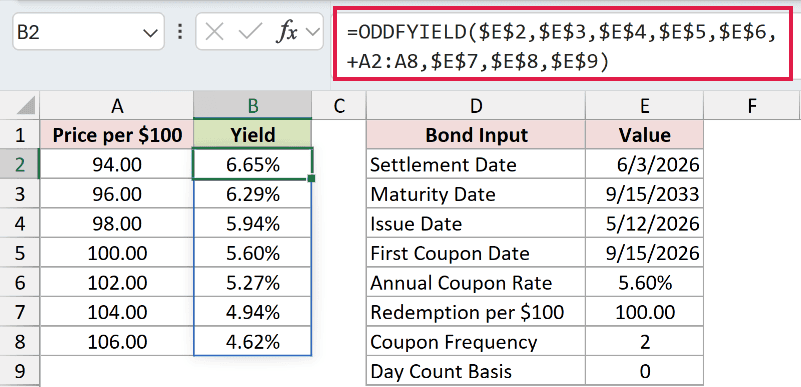
Only the price argument varies. The results spill through B8, while the absolute references keep all the other inputs fixed.
At 94.00, the yield is 6.65%. At 106.00, it falls to 4.62%. Paying more for the same scheduled payments reduces the calculated yield.
The 100.00 price produces a displayed yield of 5.60%, matching the displayed coupon rate.
Example 6: Recover Yield From a Calculated Price
You can check a price-to-yield calculation by starting with a target yield and working back to it.
Below is the dataset for Kestrel Harbor Freight. The card holds bond terms and a typed target yield, followed by cells for calculated price and recovered yield.
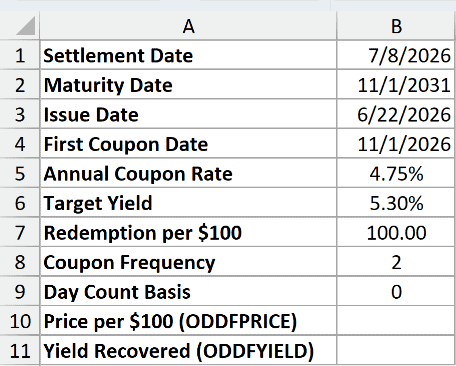
We want to check whether ODDFYIELD recovers the 5.30% target entered in B6.
ODDFPRICE calculates a bond’s price from a supplied yield while accounting for an odd first period. Here, it creates the price we’ll feed into ODDFYIELD.
Enter this formula in the white price helper cell B10:
=ODDFPRICE(B1,B2,B3,B4,B5,B6,B7,B8,B9)
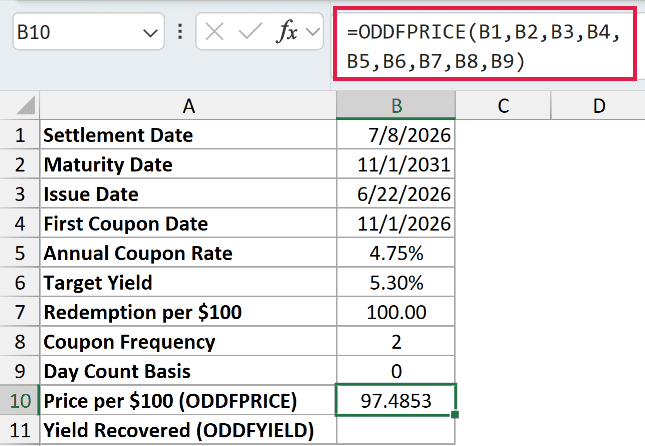
The price helper displays 97.4853 per $100 of face value.
Now enter this formula in the green recovered-yield cell B11:
=ODDFYIELD(B1,B2,B3,B4,B5,B10,B7,B8,B9)
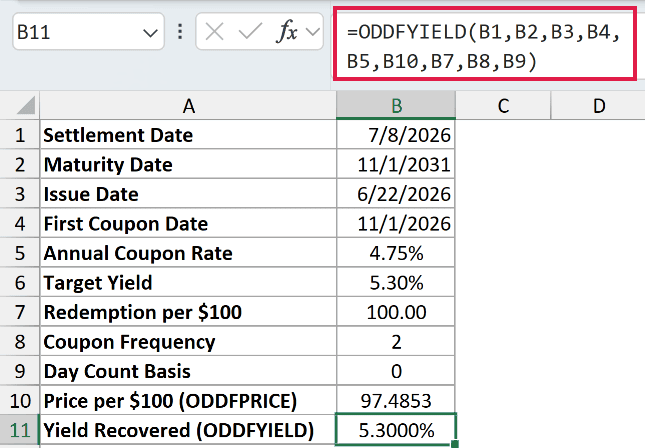
ODDFYIELD returns 5.3000%, recovering the target to the displayed precision. The coupon rate remains 4.75%; it is a separate input from the target yield.
Reference the price helper directly so the return calculation uses its full stored value. Retyping the displayed price would round the input first.
Example 7: Diagnose ODDFYIELD Errors
Finally, let’s compare a valid calculation with deliberate input mistakes.
Below is the dataset. Column A labels each case, B:E contains the dates, F contains price, and G contains frequency. Column H will show each outcome.

We want to see which inputs prevent ODDFYIELD from calculating a yield.
Enter this formula in H2:
=ODDFYIELD(+B2:B7,+C2:C7,+D2:D7,+E2:E7,5.25%,+F2:F7,100,+G2:G7,0)
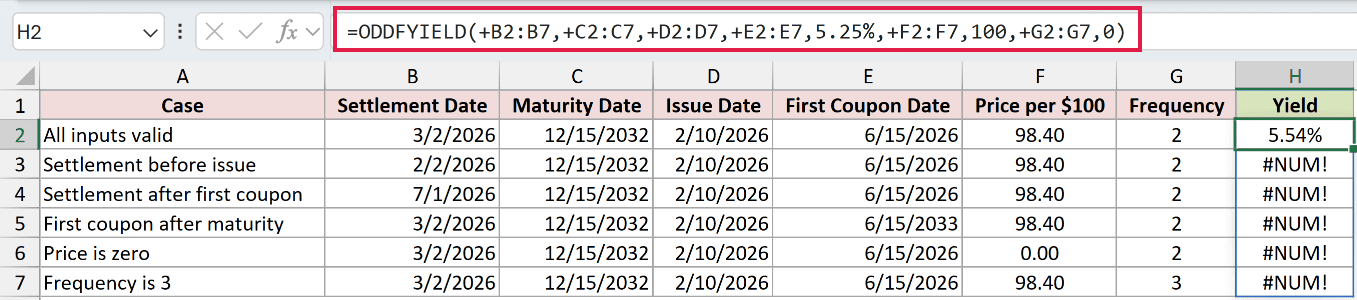
The formula enters the 5.25% annual coupon rate, 100 redemption per $100, and basis 0 directly. They stay fixed across every case.
The valid row returns 5.54%. Each remaining result is deliberately #NUM!, with a different cause:
- H3: Settlement precedes issue. Check the source dates; settlement must come after issue.
- H4: Settlement comes after the first coupon. ODDFYIELD is no longer appropriate once that opening period has passed.
- H5: The first coupon falls after maturity. Correct the coupon date or maturity date using the bond’s terms.
- H6: Price is 0.00. Enter a positive quote per $100 of face value.
- H7: Frequency is 3, which isn’t supported. Use the bond’s actual annual, semiannual, or quarterly payment frequency.
Correct the underlying input or calculation choice before relying on the yield.
Tips & Common Mistakes
- Check the first coupon against the payment schedule ending at maturity. A misaligned first coupon can return
#NUM!even when the dates are in chronological order. - Keep the
+on each range argument in the spilling examples. A bare range returns#VALUE!instead of the yield column. - Use real Excel dates. Invalid date text can return
#VALUE!, and ambiguous text makes date inputs harder to verify. - Match the basis to the bond’s terms. Don’t change it to obtain a preferred yield.
- A negative coupon rate or a zero redemption amount can return
#NUM!. Check the source inputs before changing the formula.
Other Excel articles you may also like:
