
The ODDLPRICE function in Excel returns the price per $100 face value of a bond with an irregular final interest period.
An irregular, or odd, final period is shorter or longer than the bond’s usual gap between coupon payments. A coupon is the interest the bond pays.
ODDLPRICE uses the actual last coupon date alongside settlement, maturity, and annual yield. That date matters because the final payment doesn’t follow the usual schedule.
I’ll show you how to price these bonds, convert a quote into a holding value, and compare the effects of yield and day count conventions.
ODDLPRICE Function Syntax in Excel
ODDLPRICE takes the bond’s dates and financial terms in this order:
=ODDLPRICE(settlement, maturity, last_interest, rate, yld, redemption, frequency, [basis])
- settlement (required): The date the buyer takes ownership of the bond.
- maturity (required): The date the bond reaches its end and redemption is paid.
- last_interest (required): The last coupon date before the final payment at maturity.
- rate (required): The annual coupon rate, entered as a percentage.
- yld (required): The annual yield used to calculate the price, entered as a percentage.
- redemption (required): The redemption amount per $100 face value. Use
100when redemption is at face value. - frequency (required): The regular coupon frequency:
1for annual,2for semiannual, or4for quarterly payments. - basis (optional): The day count convention.
0or omitted means US (NASD) 30/360;1means Actual/actual;2means Actual/360;3means Actual/365;4means European 30/360.
The day count convention tells Excel how to measure the time between the bond’s dates. Use the convention specified for the bond.
When to Use ODDLPRICE Function
- Price a bond whose final coupon period is shorter than its regular payment interval.
- Price a bond with a longer final coupon period.
- Calculate prices for a list of bonds using each bond’s own dates and terms.
- See how changing the required yield affects an odd-period bond’s price.
- Convert a price per $100 into the value of a holding.
Example 1: Price a Short Final Period
Let’s start with a bond whose final interest period ends earlier than the usual coupon schedule.
Below is the dataset. The card lists the bond’s dates and terms in B1:B8, with a labeled price cell in B9.
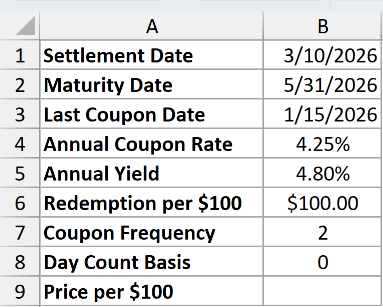
We want the price per $100 face value at the settlement date.
Enter this formula in B9:
=ODDLPRICE(B1,B2,B3,B4,B5,B6,B7,B8)
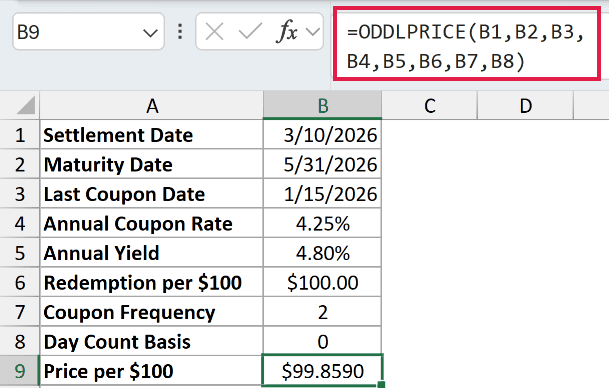
The formula returns $99.8590. That’s the price per $100 face value, so this bond is priced below face value.
Here’s how the inputs fit together:
B1:B3contain settlement3/10/2026, maturity5/31/2026, and last coupon date1/15/2026.B4contains the annual coupon rate of 4.25%, whileB5contains the annual yield of 4.80%.B6contains redemption of $100.00,B7sets semiannual payments, andB8selects US (NASD) 30/360.
The last coupon date and maturity define the short final period. Settlement tells Excel when you’re valuing the remaining payment.
Example 2: Value an Entire Bond Holding
A price quote becomes more useful when you apply it to the face value you hold.
Below is the dataset. The card contains the bond’s terms, a price cell in B9, and the typed face value held in B10.
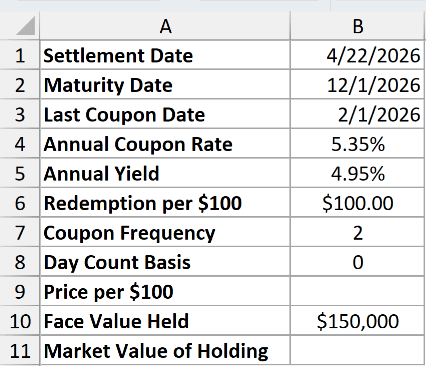
We want to calculate the bond’s price and use it to value the holding.
First, enter the ODDLPRICE formula in B9:
=ODDLPRICE(B1,B2,B3,B4,B5,B6,B7,B8)
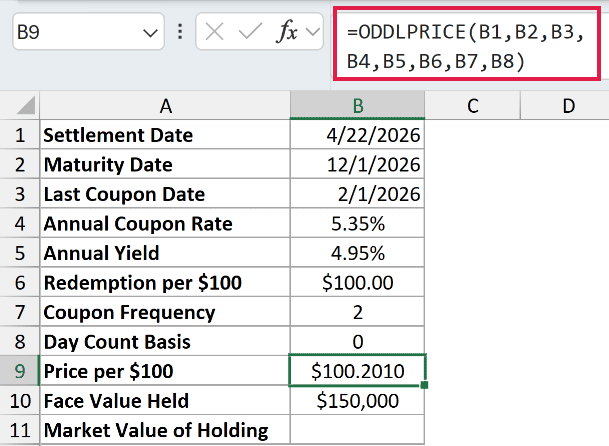
The price is $100.2010 per $100 face value. This bond has a long final period, running from 2/1/2026 to 12/1/2026 despite its semiannual frequency.
Now use the face value of $150,000 in B10. Enter this formula in B11:
=B9/100*B10
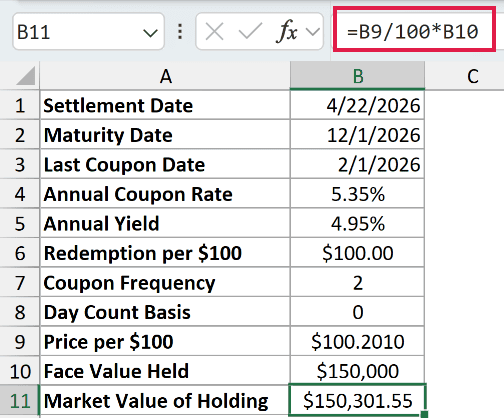
The holding value is $150,301.55. Dividing the quote by 100 converts it to a price per dollar of face value before multiplying by the holding.
The formula references B9 directly, so the calculation uses the stored price rather than a manually retyped, rounded display value.
Example 3: Price a List of Bonds
Now let’s calculate a separate price for every bond in a portfolio.
Below is the dataset. Columns A:I contain bond names, dates, rates, redemption, frequency, and basis. Column J will hold each price.

We want one formula to price every bond using the inputs on its own row.
Enter this formula in J2:
=ODDLPRICE(+B2:B7,+C2:C7,+D2:D7,+E2:E7,+F2:F7,+G2:G7,+H2:H7,+I2:I7)

Each + turns a cell range into an array of values that ODDLPRICE can process. Without those prefixes, bare range arguments return a single #VALUE! error.
The results spill automatically from J2 through J7. You enter the formula only in J2.
This spilling form works in Excel 2021, Excel 2024, and Microsoft 365. In Excel 2019 and earlier, use a per-row formula copied down, as shown later.
The prices are:
- Oakridge Water Authority: $99.7305.
- Lakeshore Rail Co.: $100.2198.
- Summit Valley Health: $99.8624.
- Brightwater Energy: $100.3476.
- Cedar Point Schools: $99.7100.
- Granite Bay Transit: $99.9791.
These bonds have long final periods. Each row keeps its own coupon frequency and basis, so the formula doesn’t impose a shared schedule on the portfolio.
Granite Bay’s coupon rate and yield both show 4.50%, yet its price is $99.9791. Matching rates don’t guarantee a price exactly at face value with an odd period.
Example 4: See How Yield Changes Price
Let’s hold the bond’s terms fixed and change only the annual yield.
Below is the dataset. Column A contains yield scenarios, and the card in D:E contains the fixed bond inputs. Column B will show prices.
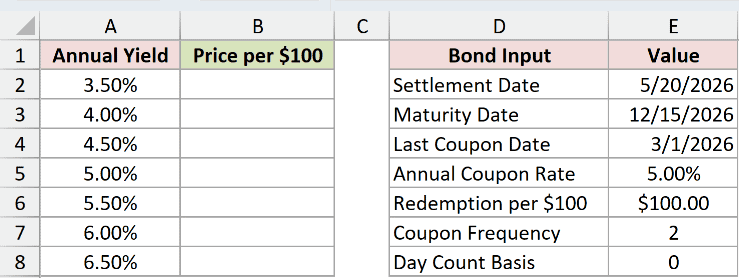
We want to see how much the price changes as the required yield rises.
Enter this formula in B2:
=ODDLPRICE($E$2,$E$3,$E$4,$E$5,+A2:A8,$E$6,$E$7,$E$8)
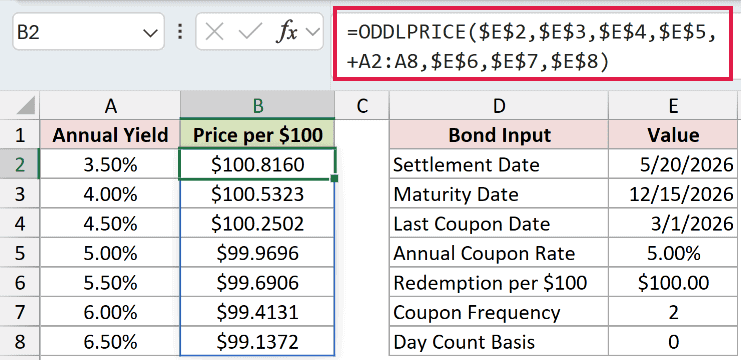
The absolute references keep the bond inputs fixed. The yield range changes by row, and prices spill into B2:B8.
At 3.50% yield, the price is $100.8160. At 6.50%, it falls to $99.1372. Every increase in yield lowers the price in this set.
The 4.50% scenario returns $100.2502, above face value. At 5.00%, matching the coupon rate, the result is $99.9696, slightly below face value.
Example 5: Compare Day Count Conventions
The day count basis can also change the price, even when the dates and rates stay fixed.
Below is the dataset. Columns A:B list basis codes and conventions, while E:F holds the bond’s dates and rates. Column C will contain prices.
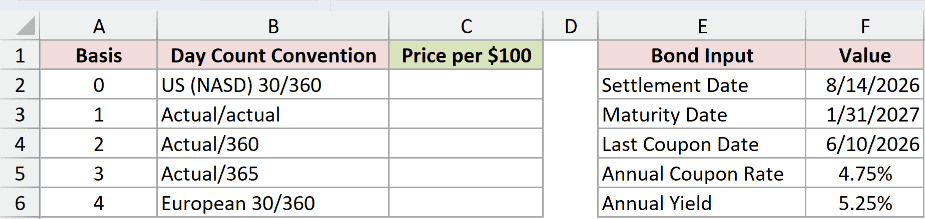
We want to price the same bond under each listed day count convention.
Enter this formula in C2:
=ODDLPRICE($F$2,$F$3,$F$4,$F$5,$F$6,100,2,+A2:A6)
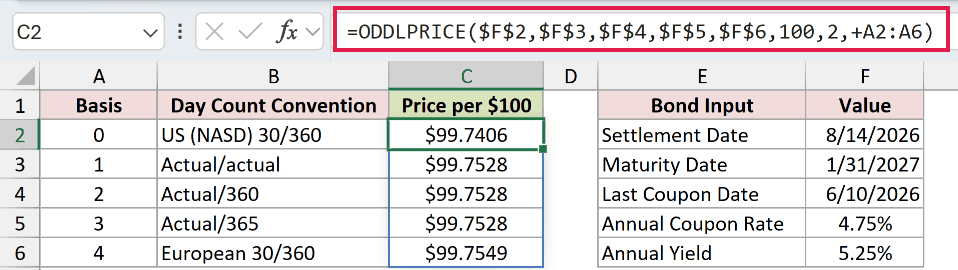
The formula enters redemption as 100 and frequency as 2 directly. These mean redemption at face value and semiannual coupons; they’re not additional rows in the card.
The basis codes vary through A2:A6, producing these prices:
- 0, US (NASD) 30/360: $99.7406.
- 1, Actual/actual: $99.7528.
- 2, Actual/360: $99.7528.
- 3, Actual/365: $99.7528.
- 4, European 30/360: $99.7549.
Notice that the Actual-based conventions display the same price here. Different basis codes don’t necessarily produce different displayed results.
Pro Tip: Choose the basis from the bond’s terms, not whichever row produces the price you prefer. Omitting basis uses 0, US (NASD) 30/360.
Example 6: Check a Regular Final Period
The actual last coupon date explains when a regular-schedule calculation agrees with ODDLPRICE.
Below is the dataset. Riverside and Fairmont share the same terms except their last coupon dates. Columns J:K will show the pricing comparison.

We want to compare a regular final period with a short final period while keeping the other inputs identical.
Enter this formula in J2, then copy it down to J3:
=ODDLPRICE(B2,C2,D2,E2,F2,G2,H2,I2)

ODDLPRICE returns $99.8441 for Riverside’s regular final period and $99.8521 for Fairmont’s short final period.
For comparison, PRICE calculates a bond price using a regular coupon schedule. It has no argument for the actual last coupon date, which matters for Fairmont.
Enter this comparison formula in K2, then copy it down to K3:
=PRICE(B2,C2,E2,F2,G2,H2,I2)

The comparison returns $99.8441 for both bonds. It matches ODDLPRICE for Riverside because Riverside’s final period follows the regular schedule.
For Fairmont, the comparison is the wrong calculation. Its $99.8441 ignores the actual last coupon date of 10/31/2026; ODDLPRICE accounts for it and returns $99.8521.
Example 7: Diagnose ODDLPRICE Errors
Finally, let’s make the invalid inputs visible alongside a working case.
Below is the dataset. Column A describes each scenario, columns B:I contain its inputs, and column J will show the price or deliberate error.

We want to identify which input causes each failed calculation.
Enter this formula in J2, then copy it down through J8:
=ODDLPRICE(B2,C2,D2,E2,F2,G2,H2,I2)

The valid row returns $99.8590. The remaining rows deliberately show errors, so treat those cells as troubleshooting demonstrations.
- J3,
#NUM!: Settlement is before the last coupon date. Check the entered dates and use a settlement within the final period. - J4,
#NUM!: Settlement equals maturity. Settlement must be earlier than maturity. - J5,
#NUM!: Yield is -1.00%. ODDLPRICE doesn’t accept a negative yield. - J6,
#NUM!: Frequency is 3. Use the bond’s supported annual, semiannual, or quarterly frequency code. - J7,
#NUM!: Basis is 5. Use a valid basis code from the syntax list. - J8,
#VALUE!: Settlement containsnot a date. Replace it with a valid Excel date.
Tips & Common Mistakes
- Keep rates annual. The coupon frequency has its own argument. Enter coupon rate and yield as percentages, as the input cards do.
- Use real Excel dates. Check imported date cells before calculating. ODDLPRICE truncates fractional date values and basis values rather than rounding them.
- Negative coupon rates also fail. A negative
ratereturns#NUM!. A zero yield is allowed, so don’t reject it as though it were negative. - Keep the quote’s units clear. ODDLPRICE returns a price per $100 face value. Scale that price by the face value held when calculating a holding value.
- Preserve the actual coupon date. Month-end dates and irregular intervals are part of the bond’s terms. Don’t replace them with an assumed regular schedule.
Start with the bond’s actual dates and stated day count convention.
Other Excel articles you may also like:
