
Excel’s ERF function returns the error function integrated between zero and a supplied lower limit, or between two limits when you include the optional upper limit.
This mathematical function is especially useful for converting standardized values into normal-distribution probabilities, including shares within tolerance bands or below service targets.
In this article, I’ll show you how to interpret one-limit and two-limit results, calculate normal probabilities, and evaluate specification and service-level ranges.
ERF Function Syntax in Excel
The ERF function uses the following syntax:
=ERF(lower_limit,[upper_limit])
lower_limit: The lower bound of the integration. Whenupper_limitis omitted, Excel integrates from 0 to this value.upper_limit: The optional upper bound of the integration.
When to Use ERF Function
- Evaluate the error function for positive, negative, or zero inputs.
- Measure the error-function integral between two specified limits.
- Calculate the share of a normal distribution within a given number of standard deviations.
- Estimate the share of measurements inside specification limits.
- Calculate the share of normally distributed observations at or below a target.
Example 1: Calculate ERF for Individual Values
Let’s start with the one-argument form.
Below is the dataset with Input Value (x) entries in A2:A11. The ERF Result cells in B2:B11 are blank before we enter the formula.
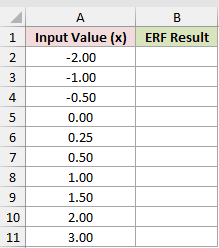
We want to calculate the error function from 0 to each value in column A.
Here is the formula:
=ERF(A2)
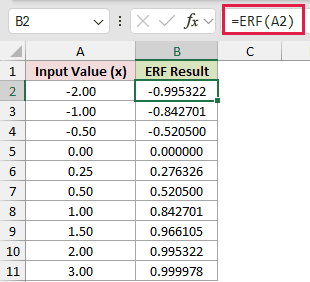
Cell B2 applies ERF to -2 in A2 and returns -0.995322. Filling the formula through B11 calculates one result for each input.
Positive and negative inputs mirror each other. For example, 1 returns 0.842701 and -1 returns -0.842701. A zero input returns 0.
One-argument ERF results stay between -1 and 1. At x = 3, the result is 0.999978, already very close to 1.
Entering =ERF(A2:A11) does not spill. It returns a single #VALUE!, so enter the one-value formula in B2 and fill it through B11.
Example 2: Calculate ERF Between Two Limits
Now let’s add the optional upper limit.
Below is the dataset with Lower Limit values in A2:A8, Upper Limit values in B2:B8, and empty ERF Between Limits cells in C2:C8.
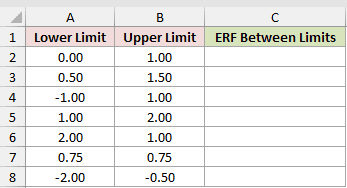
We want to calculate the error-function integral between each pair of limits.
Here is the formula:
=ERF(A2,B2)
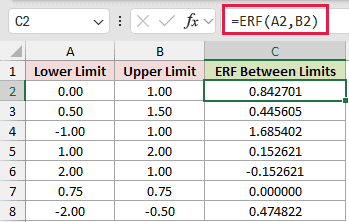
Cell C2 integrates from 0 to 1 and returns 0.842701. The formula is then filled through C8 for the remaining limit pairs.
The two-argument form equals ERF(upper)-ERF(lower). Unlike ERF(x), its result is not restricted to values between -1 and 1.
The -1 to 1 interval returns 1.685402, while reversed limits from 2 to 1 return -0.152621. Matching lower and upper limits return 0.
Example 3: Calculate Probability Within Sigma Limits
Here’s how ERF connects to a normal distribution.
Below is the dataset with Sigma Level (k) values in A2:A8. The two result columns are blank until we add the formulas.
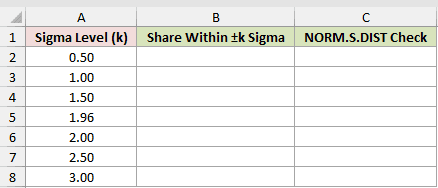
We want to calculate the share within plus or minus each sigma level, then verify the ERF result against NORM.S.DIST.
Here is the formula:
=ERF(A2/SQRT(2))
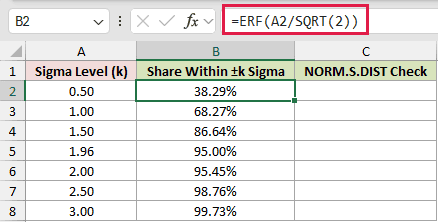
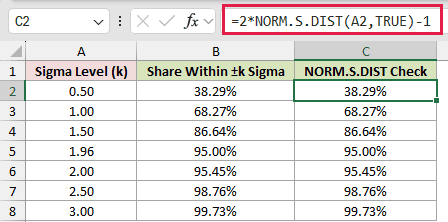
Here is the checking formula:
=2*NORM.S.DIST(A2,TRUE)-1
How these formulas work:
- Dividing the sigma level in A2 by
SQRT(2)before passing it to ERF makes the result equal the share within plus or minus k standard deviations. - At k = 0.5, both B2 and C2 return 38.29%.
- At k values of 1, 1.96, 2, and 3, the matching shares are 68.27%, 95.00%, 95.45%, and 99.73%. Here, 1.96 is the familiar two-tailed 95% critical value.
- The NORM.S.DIST formula calculates the same central share, confirming the ERF result in every row.
Example 4: Calculate Share Within Specification Limits
Let’s apply the two-limit form to manufacturing measurements.
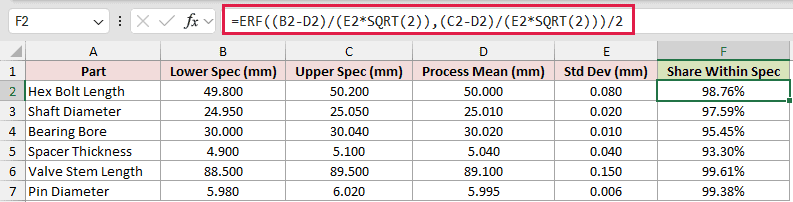
Below is the dataset for six parts with Lower Spec (mm), Upper Spec (mm), Process Mean (mm), and Std Dev (mm) columns.
The Share Within Spec cells in F2:F7 are blank before we enter the formula.
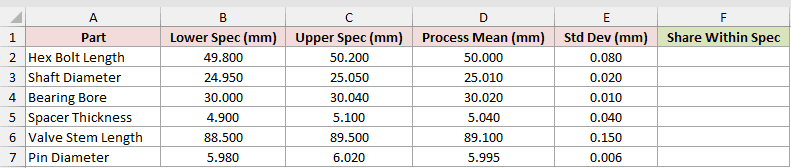
We want to calculate the expected share of each part’s measurements that falls between its lower and upper specifications.
Here is the formula:
=ERF((B2-D2)/(E2*SQRT(2)),(C2-D2)/(E2*SQRT(2)))/2
How this formula works:
- The first ERF argument subtracts the process mean from the lower limit, then divides by the standard deviation times
SQRT(2). The second does the same for the upper limit. - The two-argument ERF measures the band between those limits. Dividing the result by 2 returns the normal share inside that band.
- For Hex Bolt Length, the formula returns 98.76%. The same structure also handles rows where the process mean is off-center.
A more direct statistical formula is =NORM.DIST(C2,D2,E2,TRUE)-NORM.DIST(B2,D2,E2,TRUE). It works directly with the measurements in millimeters. The ERF version shows how each specification limit is transformed before the interval probability is calculated.
Example 5: Calculate Share Within an SLA
Here’s a one-sided probability for support operations.
Below is the dataset with Support Team, Mean Resolution (Hours), Std Dev (Hours), and SLA Target (Hours) values.
The Share Within SLA cells in E2:E7 are blank until we enter the formula.
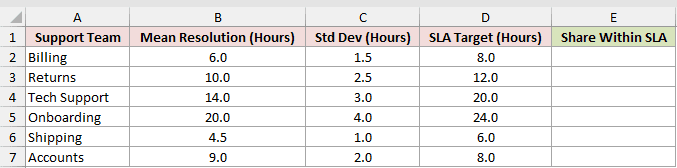
We want to estimate the share of tickets each support team resolves at or below its SLA target.
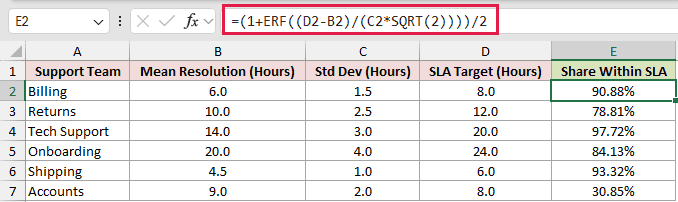
Here is the formula:
=(1+ERF((D2-B2)/(C2*SQRT(2))))/2
How this formula works:
- The inner calculation subtracts the team’s mean from the SLA target, then divides by the standard deviation times
SQRT(2). - Adding 1 and dividing by 2 shifts ERF’s symmetric output into a cumulative share from 0 to 1.
- Billing returns 90.88%. Accounts returns 30.85% because its 8-hour target is below its 9-hour mean.
The direct normal-distribution formula is =NORM.DIST(D2,B2,C2,TRUE). It returns the same share from the target, mean, and standard deviation. The ERF version shows how its centered result becomes a cumulative probability.
Tips & Common Mistakes
- For a table of inputs, enter ERF in the first result row and fill it down. Passing the full range to ERF returns one
#VALUE!instead of multiple results. ERF.PRECISE(x)takes one argument and returns the same result as the one-argument formERF(x).ERFC(x)returns1-ERF(x), which is useful when you need the complementary tail rather than the central ERF result.- Non-numeric text supplied as either limit returns
#VALUE!, while numbers stored as text still calculate. - Excel 2007 returned
#NUM!for negative inputs. Negative inputs work in Excel 2010 and later, returning mirrored results. - A two-limit result equals
ERF(upper)-ERF(lower). It can exceed 1 when the limits lie on opposite sides of zero, while reversed limits produce a negative result.
I’ve covered one-limit and two-limit ERF results, including their use in sigma ranges. I also showed how they apply to specification limits and SLA targets.
I hope you found this article helpful.
Related Excel Functions / Articles:
