If you want to count how many values fall into each range, like test scores by grade band or orders by price bracket, the FREQUENCY function is what you’re looking for.
It groups a list of numbers into buckets you define and tells you how many values land in each one.
FREQUENCY is a dynamic array function. In Excel 365 it spills its results down the cells below from a single formula, so there is no need to press Ctrl+Shift+Enter.
FREQUENCY Function Syntax in Excel
The FREQUENCY function counts how often values occur within the ranges you set.
=FREQUENCY(data_array, bins_array)
- data_array – the list of numbers you want to count.
- bins_array – the upper limits that define each bucket.
FREQUENCY returns a vertical array of counts. It always returns one more number than there are bins, because the last value counts everything above the highest bin.
When to Use FREQUENCY Function
- Build a frequency distribution to see how data spreads across ranges.
- Group test scores into grade bands like A, B, C, and so on.
- Bucket order amounts or sales figures into price ranges.
- Split customers into age groups for a quick demographic view.
- Count how many values sit above or below a single cutoff.
Example 1: Count Test Scores by Grade Band
Let’s start with a classic case, sorting exam scores into grade bands.
Below is the dataset. Column A holds 15 test scores. Column B is left blank as a separator. Columns C, D, and E form a small summary table next to the data.
In that summary table, column C is a plain-language label for each range, column D holds the numeric upper limit for each bucket, and column E will hold the counts.
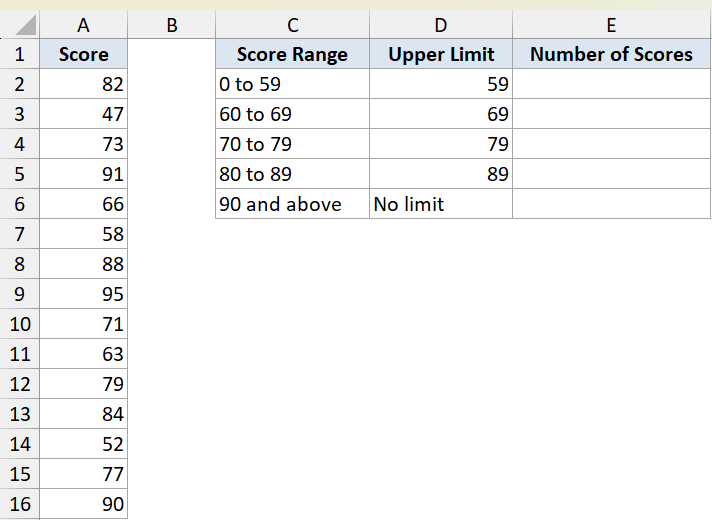
We want to count how many scores fall into each grade band defined by the upper limits in column D.
Here is the formula:
=FREQUENCY(A2:A16,D2:D5)
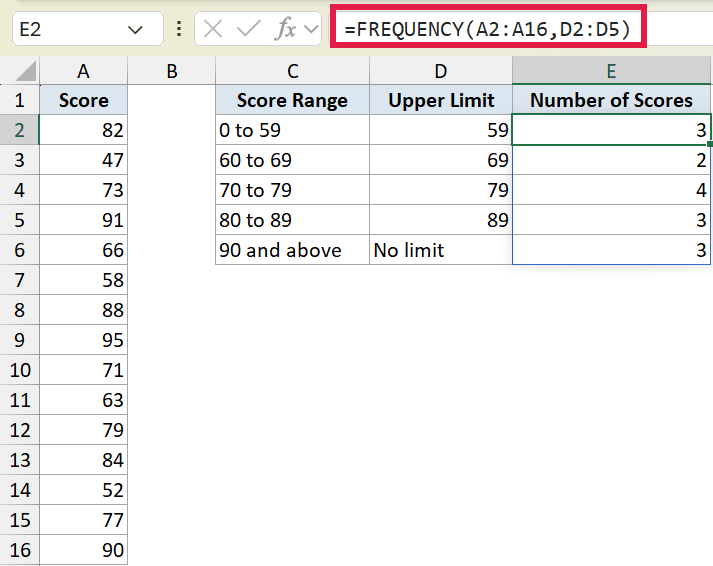
The bins in column D are upper limits. D2 is 59, so the first count is every score up to and including 59. D3 is 69, so the next count is scores from 60 to 69, and so on.
Notice the count column has five rows but column D only has four bins. FREQUENCY returns one extra number for everything above the highest bin. That overflow row is the “90 and above” label in C6.
The counts here are 3, 2, 4, 3, and 3.
Pro Tip: In older versions of Excel before 365, FREQUENCY did not spill. You had to select the whole result range first, type the formula, then press Ctrl+Shift+Enter to enter it as an array. In Excel 365 a single formula spills on its own.
Example 2: Group Order Amounts into Price Ranges
Here’s another practical scenario, sorting orders by how much each one was worth.
Below is the dataset. Column A holds 14 order amounts. Column B is a blank separator. Columns C, D, and E hold the summary table.
Column C labels each price range in plain language, column D holds the numeric upper limit for each range, and column E will hold the order counts.
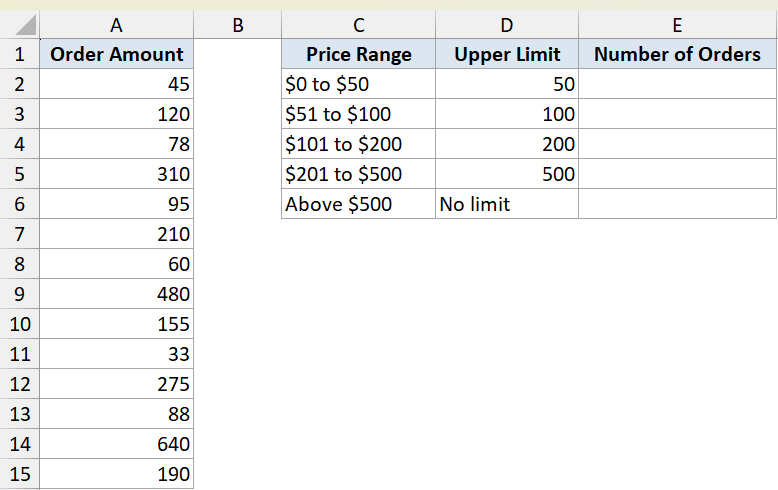
We want to count how many orders fall into each price range set by the upper limits in column D.
Here is the formula:
=FREQUENCY(A2:A15,D2:D5)
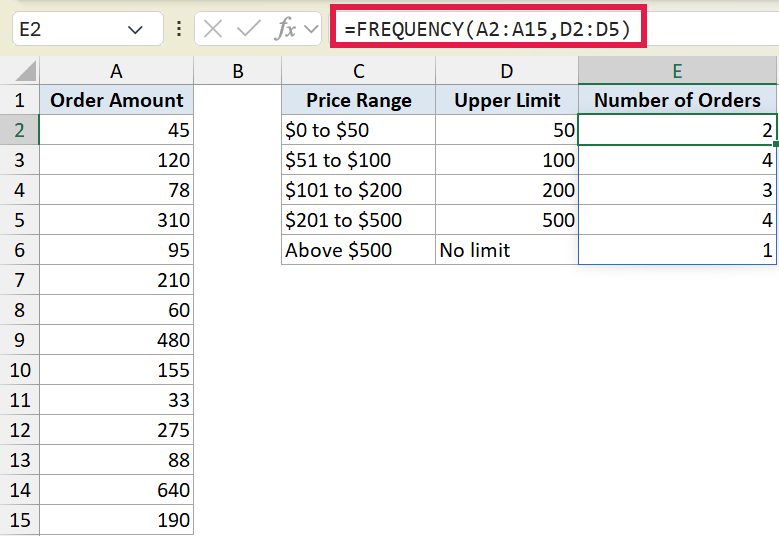
The result spills down five cells. The first four match the four bins in column D, and the fifth is the overflow count for orders above $500.
The counts here are 2, 4, 3, 4, and 1.
Example 3: Use Unequal Bin Widths for Age Groups
Let’s try something the even-spaced examples don’t show. Your buckets do not have to be the same width.
Below is the dataset. Column A holds 14 customer ages. Column B is a blank separator. Columns C, D, and E hold the summary table.
Notice the age groups have different widths. “Under 18” spans many years while “50 to 64” spans 15. The upper limits in column D handle that just fine.
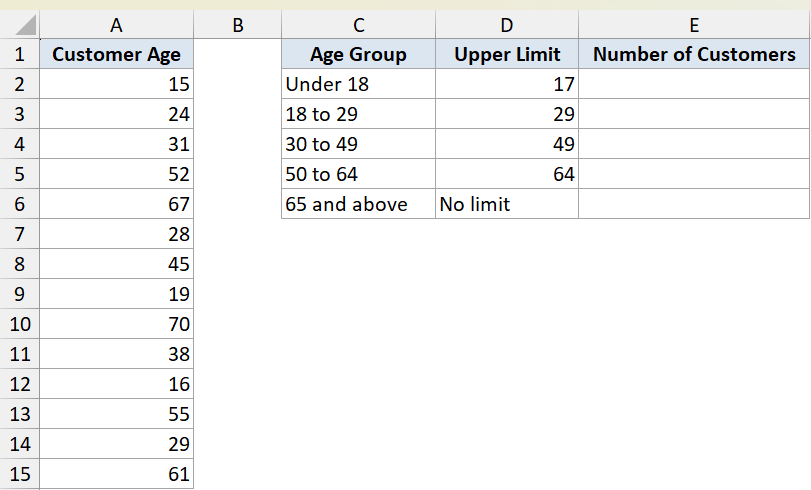
We want to count how many customers fall into each age group, even though the groups are not evenly spaced.
Here is the formula:
=FREQUENCY(A2:A15,D2:D5)
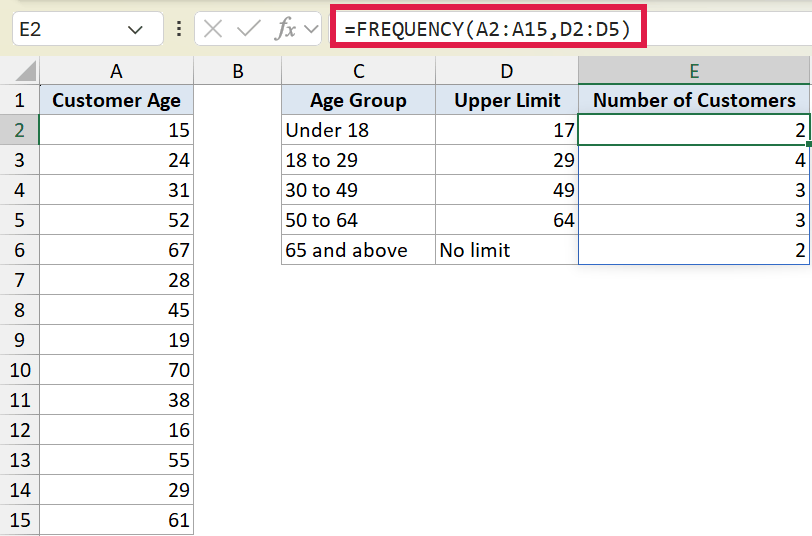
The bins are 17, 29, 49, and 64. They are not evenly spaced, and FREQUENCY does not care. It just counts everything up to each upper limit.
The counts here are 2, 4, 3, 3, and 2.
Pro Tip: If you want bins you can edit on the fly or use with conditions, COUNTIFS is a good alternative. You write one COUNTIFS per bucket, which is more typing, but each count sits in its own cell so you can tweak the ranges without re-entering an array.
Example 4: Count Unique Numbers with FREQUENCY
Here’s a clever trick FREQUENCY can pull off, counting how many unique numbers are in a list.
Below is the dataset. Column A holds 10 member IDs, some of which repeat. Column B is a blank separator. Column C will hold a single result, the count of unique IDs.
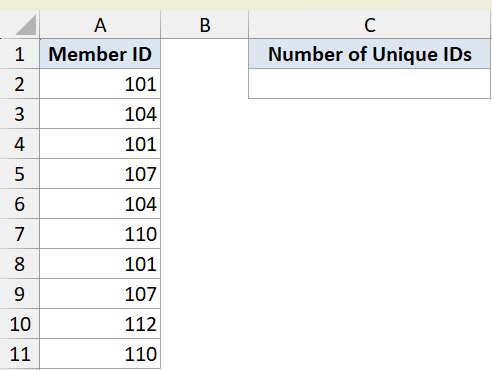
We want a single number that tells us how many distinct member IDs appear in column A.
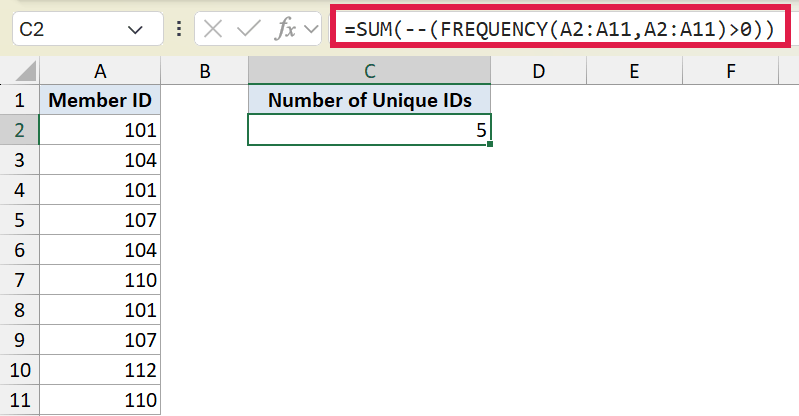
Here is the formula:
=SUM(--(FREQUENCY(A2:A11,A2:A11)>0))
How this formula works:
- Using the data as both arguments, FREQUENCY counts each number once and returns 0 for repeats.
- The
>0check turns every counted value into TRUE and every repeat into FALSE. - The double minus converts TRUE to 1 and FALSE to 0, and SUM adds them up.
The result is 5, the number of distinct IDs in the list.
Pro Tip: In Excel 365 there is a much simpler way to count unique values: =COUNTA(UNIQUE(A2:A11)). The FREQUENCY trick is worth knowing because it still works in older Excel versions where COUNTA with UNIQUE is not available.
Example 5: Split Values at a Single Cutoff
For the last example, let’s use just one bin to split values into two groups.
Below is the dataset. Column A holds 10 daily sales figures. Column B is a blank separator. Columns C, D, and E hold the summary table with a single cutoff.
Column D2 holds one number, 1000. With a single bin, FREQUENCY returns two counts: values at or below the cutoff, and values above it.
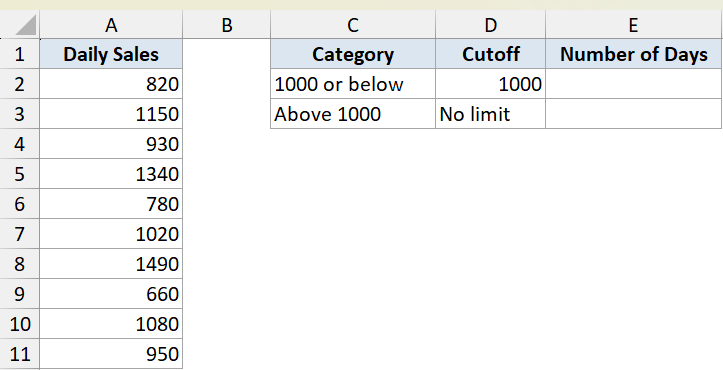
We want to know how many days had sales at or below 1000 and how many were above it.
Here is the formula:
=FREQUENCY(A2:A11,D2)
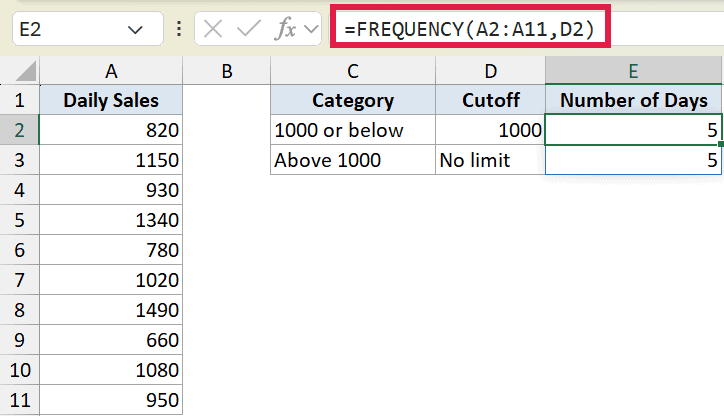
The first count is days with sales of 1000 or below. The second count is the overflow, days with sales above 1000. Even with one bin, you still get that extra row.
The counts here are 5 and 5.
Tips & Common Mistakes
- FREQUENCY returns one more value than the number of bins. Leave room for that overflow row or you will miss the last count.
- The bins are upper limits and FREQUENCY treats them as “less than or equal to.” A value exactly on a bin limit goes into that bin, not the next one.
- In Excel 365 the result spills automatically from one formula. In older versions you must select the full result range and press Ctrl+Shift+Enter.
- For quick visuals, Excel also has a built-in <a href=”https://spreadsheetplanet.com/excel-glossary/”>Histogram</a> chart that buckets data for you without writing a formula.
That’s the FREQUENCY function. You set the upper limits, and it counts how many values land in each bucket, plus everything above the top one. It also handles unequal bins and even doubles as a count-unique trick when you need one.
Related Excel Functions / Articles: