
Excel’s T.INV function returns the left-tailed inverse of the Student’s t-distribution. It finds the t value whose cumulative probability on the left matches the probability you supply.
That left-tail definition controls the sign. Lower-tail probabilities produce negative cutoffs, while probabilities above 50% produce positive cutoffs.
In this article, I’ll show you how to find lower-tail and upper-tail critical values, build a confidence interval, and create a reference table with T.INV.
T.INV Function Syntax in Excel
T.INV requires a cumulative probability and the distribution’s degrees of freedom.
=T.INV(probability, deg_freedom)
probabilityis the cumulative left-tail probability associated with the Student’s t-distribution.deg_freedomis the number of degrees of freedom used to characterize the distribution.
When to Use T.INV Function
- Find a negative critical t value for a lower-tail test.
- Convert an upper-tail alpha into a positive critical t value.
- Build the critical values and margin of error for a confidence interval.
- Create a reference table of t cutoffs for different percentiles and degrees of freedom.
Example 1: Find Lower-Tail Critical Values
Lower-tail significance levels go directly into T.INV.
Below is the dataset with quality checks, lower-tail alpha levels, degrees of freedom, and critical t values.
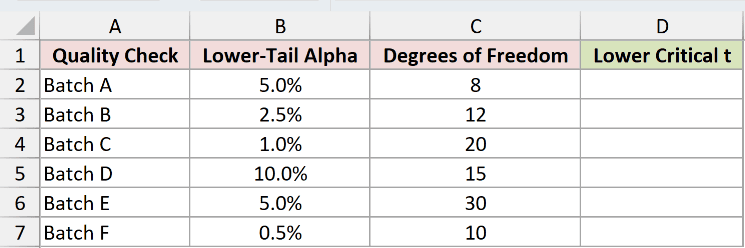
We want to return the negative rejection cutoff for each lower-tail test.
Here is the formula:
=T.INV(B2:B7,C2:C7)
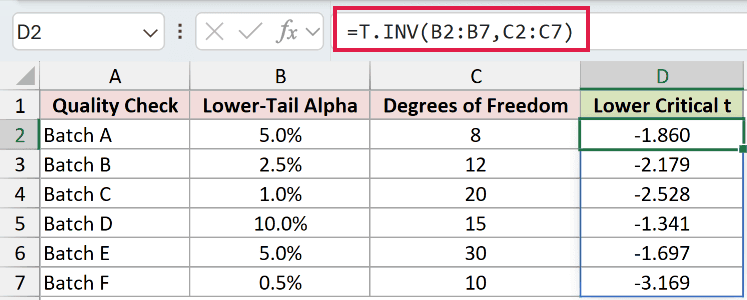
The probability and degrees-of-freedom ranges spill six results from D2. For Batch A, a 5% lower tail with 8 degrees of freedom returns -1.860.
The remaining displayed cutoffs are -2.179, -2.528, -1.341, -1.697, and -3.169.
In Excel 2021, Excel 2024, and Microsoft 365, the range formula spills automatically. Earlier versions need a per-row formula.
Pro Tip: A negative result is expected for a lower-tail probability below 50%. The sign identifies the side of the distribution.
Example 2: Find Upper-Tail Critical Values
An upper-tail alpha needs one conversion before it enters T.INV.
Below is the dataset with signal reviews, upper-tail alpha levels, degrees of freedom, and positive critical t values.
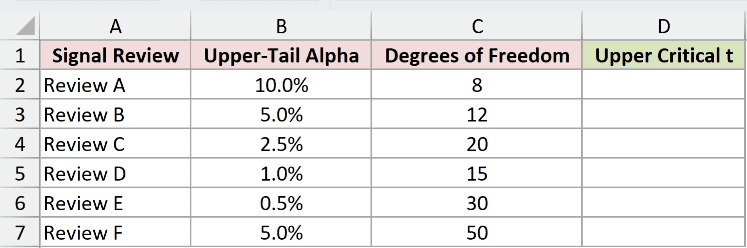
We want to convert each upper-tail alpha to a left cumulative probability and return its positive cutoff.
Here is the formula:
=T.INV(1-B2:B7,C2:C7)
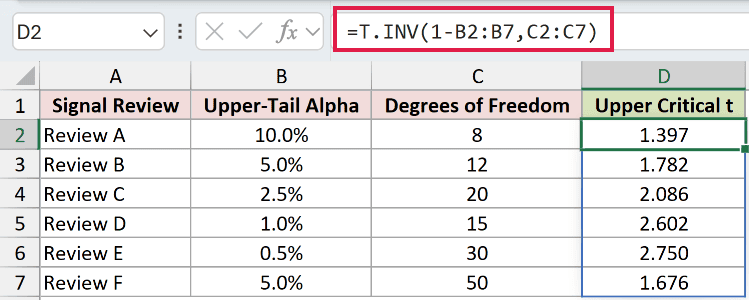
Subtracting alpha from 1 converts the right-tail area to the cumulative probability on the left.
Review A uses a 10% upper tail and 8 degrees of freedom, so T.INV evaluates the 90th percentile and returns 1.397.
The other displayed cutoffs are 1.782, 2.086, 2.602, 2.750, and 1.676.
Pro Tip: Entering upper-tail alpha directly would return a negative lower-tail cutoff. Use 1-alpha when you need the positive upper cutoff.
Example 3: Build a Confidence Interval
A confidence interval uses both critical values and the sample’s standard error.
This one-sample t interval estimates a population mean from 25 independent observations, assuming an approximately normal population and an unknown population standard deviation.
Below is the parameter card with a sample mean, sample standard deviation, sample size, 95% confidence level, and calculated interval values.
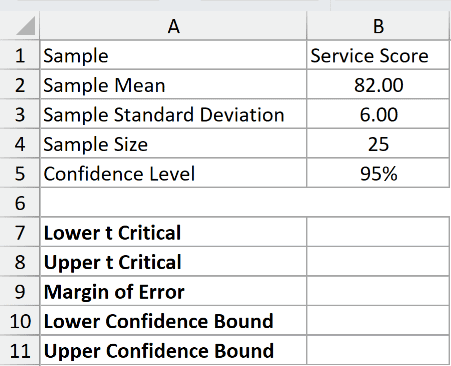
We want to calculate both t cutoffs, the margin of error, and the lower and upper confidence bounds.
Here is the lower critical t formula in B7:
=T.INV((1-B5)/2,B4-1)
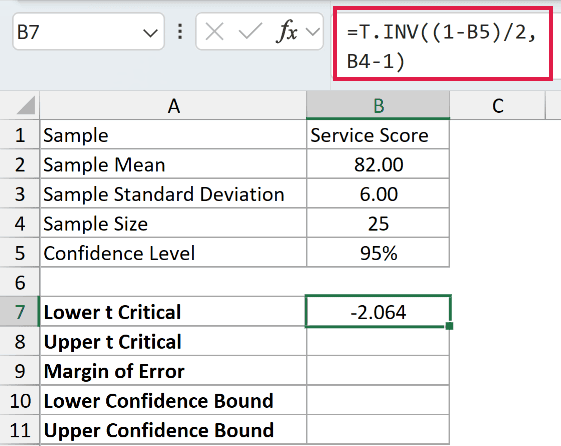
The 95% confidence level leaves 5% outside the interval. Dividing that area between two tails gives a 2.5% left-tail probability and returns -2.064.
Here is the upper critical t formula in B8:
=T.INV(1-(1-B5)/2,B4-1)
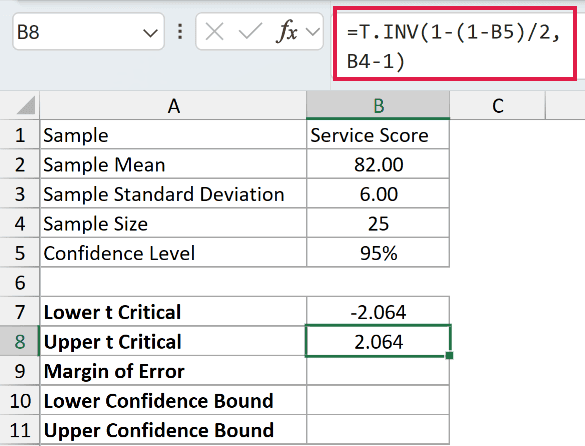
The upper formula uses the 97.5th percentile and returns 2.064. Both formulas use 24 degrees of freedom, calculated as the sample size minus 1.
Here is the margin-of-error formula in B9:
=B8*B3/SQRT(B4)
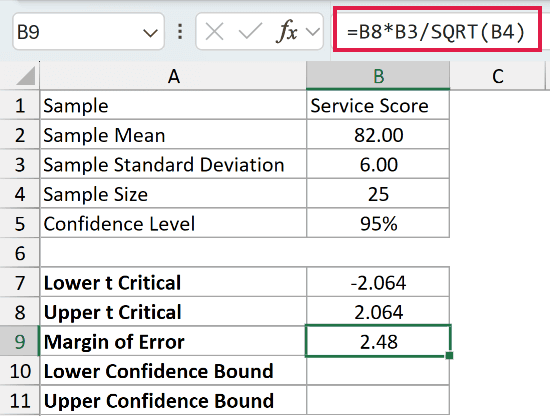
The formula multiplies the positive critical t by the sample standard error and returns 2.48.
Here is the lower confidence bound formula in B10:
=B2-B9
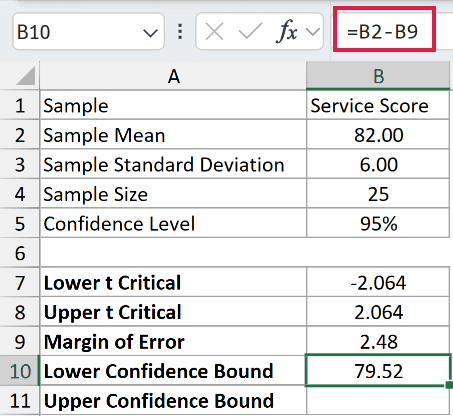
Subtracting the margin of error from the sample mean returns a lower bound of 79.52.
Here is the upper confidence bound formula in B11:
=B2+B9
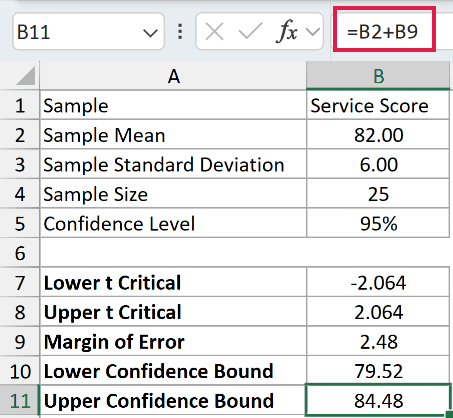
Adding the margin of error to the sample mean returns an upper bound of 84.48.
Pro Tip: For a positive two-sided critical value, =T.INV.2T(1-B5,B4-1) is more direct and returns the same 2.064 magnitude.
Example 4: Create a t Cutoff Table
T.INV can return cutoffs for any valid cumulative percentile, not only test alpha levels.
Below is the dataset with planning scenarios, target percentiles, degrees of freedom, and t cutoffs.
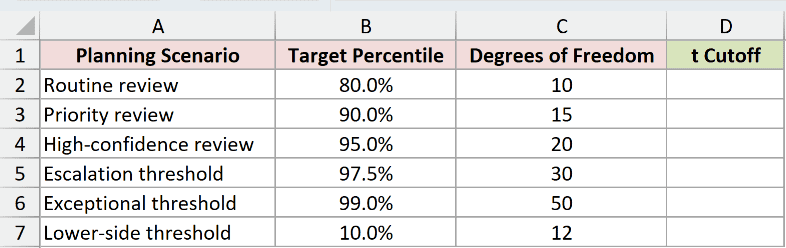
We want to build a reference table for several percentiles and degrees of freedom.
Here is the formula:
=T.INV(B2:B7,C2:C7)
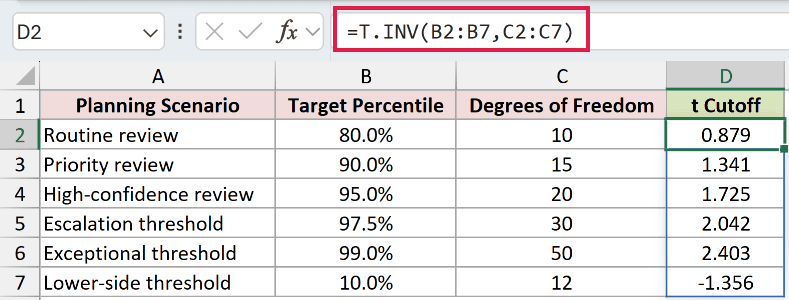
The displayed cutoffs are 0.879, 1.341, 1.725, 2.042, 2.403, and -1.356.
Percentiles above 50% return positive cutoffs. The 10th percentile in the last row returns a negative cutoff because it lies on the distribution’s left side.
Tips & Common Mistakes
- T.INV uses a cumulative left-tail probability. Convert a right-tail alpha with
1-alphabefore using it. - Use T.INV.2T for a positive two-tailed critical value when you already have the combined area in both tails.
- T.DIST performs the forward calculation. It returns a probability for a supplied t value, while T.INV returns a t value for a supplied probability.
- Use T.TEST when you need a p-value from two samples. T.INV returns a critical value from a probability and degrees of freedom.
- Keep probability above 0 and below 1 when you need a finite cutoff.
- Degrees of freedom must be at least 1. Excel truncates a noninteger value rather than rounding it.
- T.INV returns one result per probability and degrees-of-freedom pair when ranges are supplied in current dynamic-array versions.
- The older TINV function is a compatibility function for a two-tailed inverse. Use T.INV or T.INV.2T in new workbooks.
I covered lower-tail and upper-tail cutoffs, a complete confidence interval, and a percentile reference table.
I hope you found this article helpful.
Related Excel Functions / Articles:
