
Excel’s VAR.S function estimates variance from a sample of a larger population. It measures spread around the sample mean and divides the squared deviations by n minus 1.
The result uses squared units, such as min² or days². VAR.S replaces the legacy VAR function, while VAR.P is for a complete population.
In this article, I’ll show you how to interpret sample variance, check which values are counted, and compare vendor consistency with VAR.S.
VAR.S Function Syntax in Excel
The VAR.S function uses the following syntax:
=VAR.S(number1,[number2],...)
- number1: The first number, range, array, or reference for the sample.
- number2, …: Optional additional sample values, ranges, arrays, or references. VAR.S accepts up to 254 number arguments.
When to Use VAR.S Function
- Estimate variance from a sample drawn from a larger group.
- Compare the consistency of samples from two processes or vendors.
- Calculate sample variance for one group selected from a larger table.
- Check how much sampled measurements spread around their mean.
Example 1: Interpret Sample Variance
Let’s begin with a sample of customer-service calls from a much larger call volume.
Below is the dataset with eight sampled wait times in minutes.
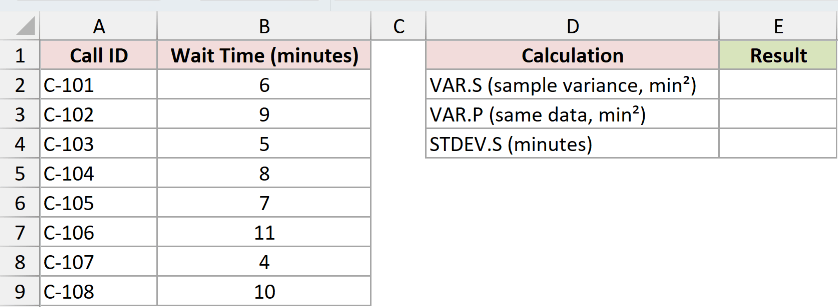
I want to estimate the variance of wait times across the wider call population.
Here is the VAR.S formula:
=VAR.S(B2:B9)
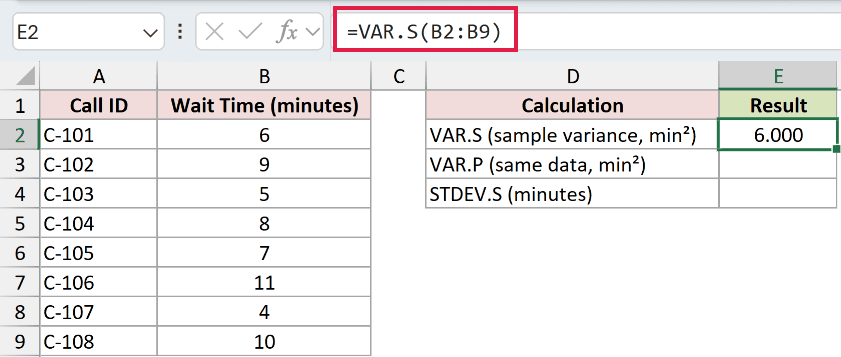
The result is 6.000 min². VAR.S uses the eight observations but divides their total squared deviation by seven, which is n minus 1.
For comparison, here is the population-variance formula:
=VAR.P(B2:B9)
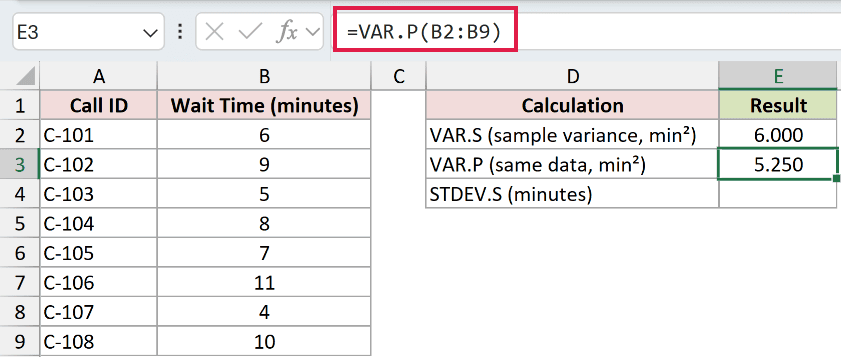
VAR.P returns 5.250 min² because it divides by all eight observations. That calculation would be appropriate only if these calls were the full population.
Here is the companion standard-deviation formula:
=STDEV.S(B2:B9)
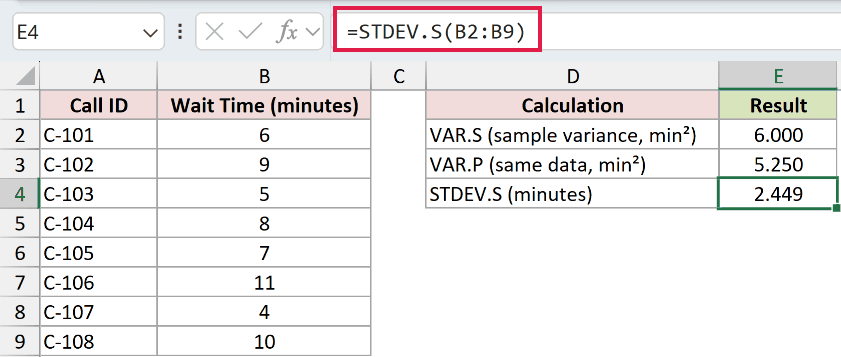
STDEV.S returns 2.449 minutes, the square root of 6.000. Its original unit makes the spread easier to compare with the wait times themselves.
Pro Tip: Do not describe a variance of 6 min² as six minutes. Use STDEV.S when you need a result in the original measurement unit.
Example 2: Check the Effective Sample Size
Nonnumeric entries can silently reduce the sample used by VAR.S.
Below is the dataset with field measurements, numeric text, TRUE, a blank, and a Pending label.
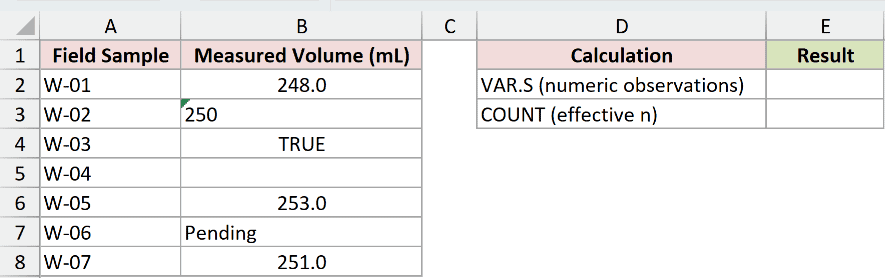
I want to calculate sample variance and confirm how many numeric observations Excel includes.
Here is the VAR.S formula:
=VAR.S(B2:B8)
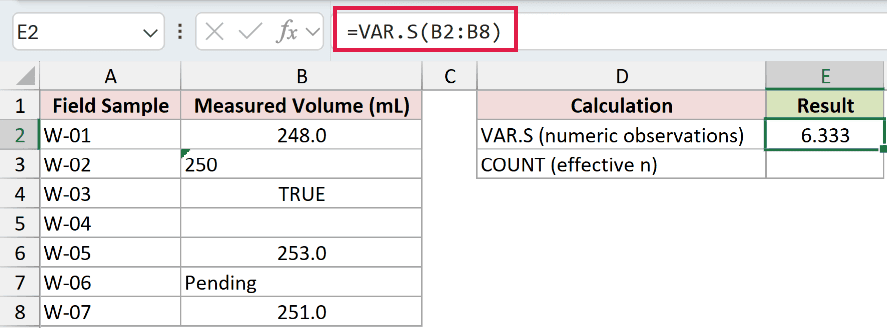
VAR.S uses 248, 253, and 251. It ignores the numeric text “250,” TRUE, the blank cell, and Pending, returning 6.333 mL².
Use COUNT to verify the effective sample size:
=COUNT(B2:B8)
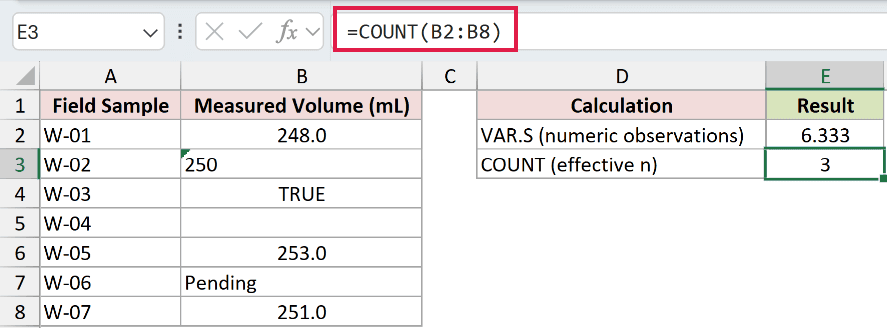
COUNT returns 3, confirming that only three cells contribute to the variance. That matters because VAR.S divides by the effective n minus 1.
Pro Tip: Use VARA when logical values and text in a reference should affect sample variance. VARA treats TRUE as 1 and FALSE or text labels as 0.
Example 3: Calculate Conditional Sample Variance
You can combine VAR.S with FILTER when one subgroup is still a sample of a wider process.
Below is the dataset with sampled support incidents, resolution times, and a selected incident type.
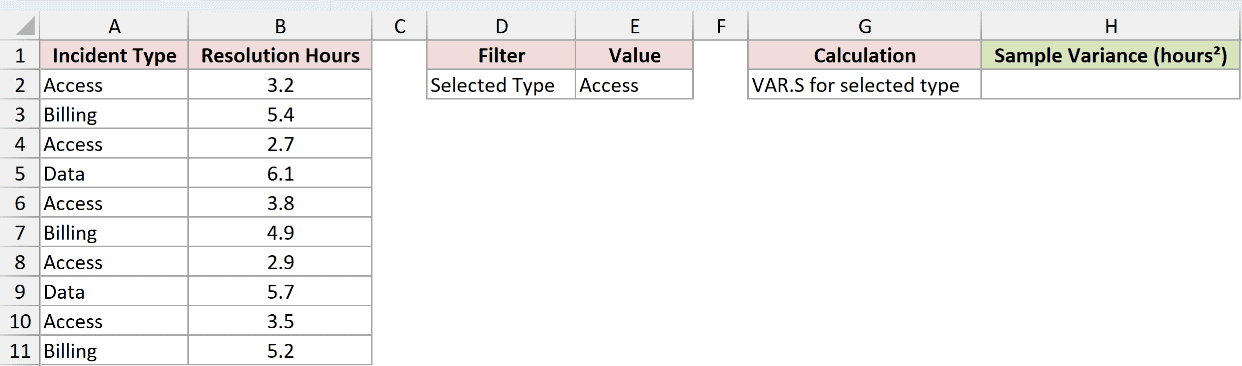
I want to estimate variance for the sampled Access incidents only.
Here is the formula:
=VAR.S(FILTER(B2:B11,A2:A11=$E$2))
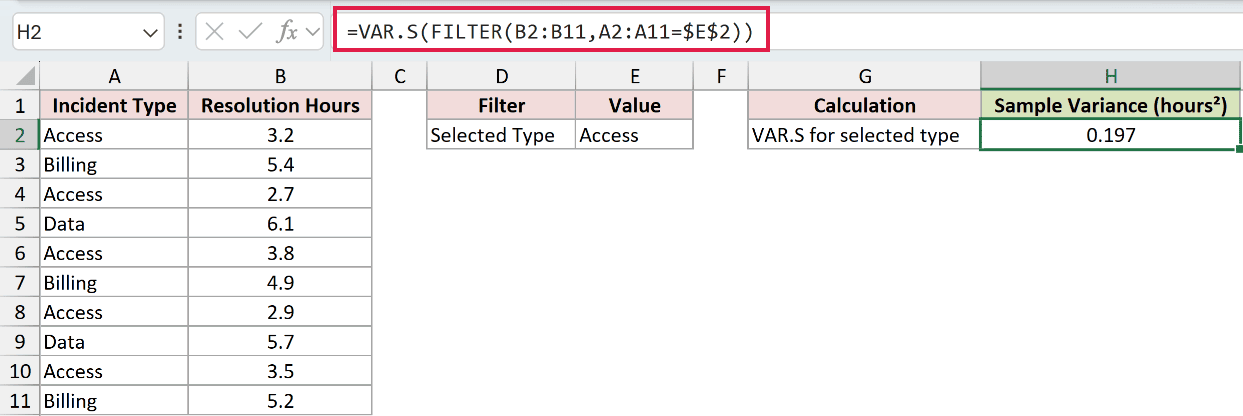
FILTER returns 3.2, 2.7, 3.8, 2.9, and 3.5 hours. VAR.S reduces that sample to one variance of 0.197 hours².
Pro Tip: This formula requires FILTER, which is available in Microsoft 365, Excel 2024, and Excel 2021. VAR.S itself also works in Excel 2019 and Excel 2016.
Example 4: Compare Vendor Consistency
The final example compares two shipment samples from larger vendor histories.
Below is the dataset with eight sampled delivery delays from each vendor.
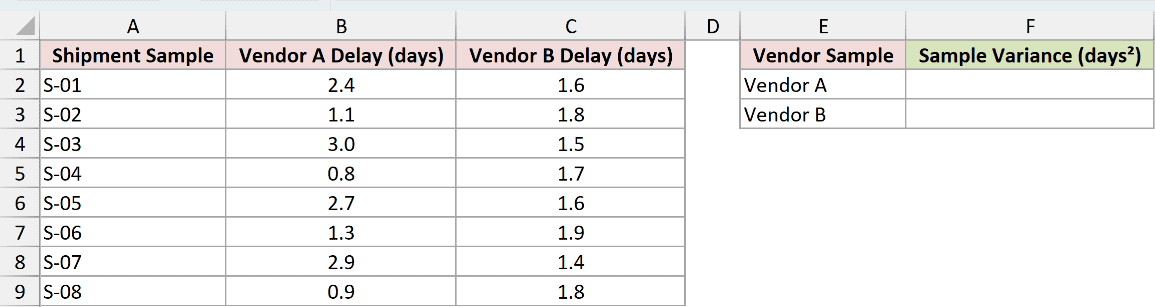
I want to identify which vendor sample has more consistent delays.
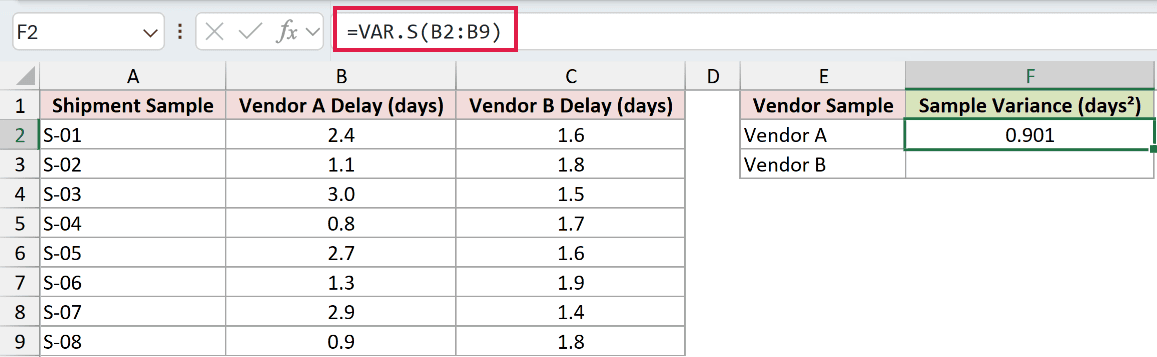
Here is the formula for Vendor A:
=VAR.S(B2:B9)
And here is the formula for Vendor B:
=VAR.S(C2:C9)
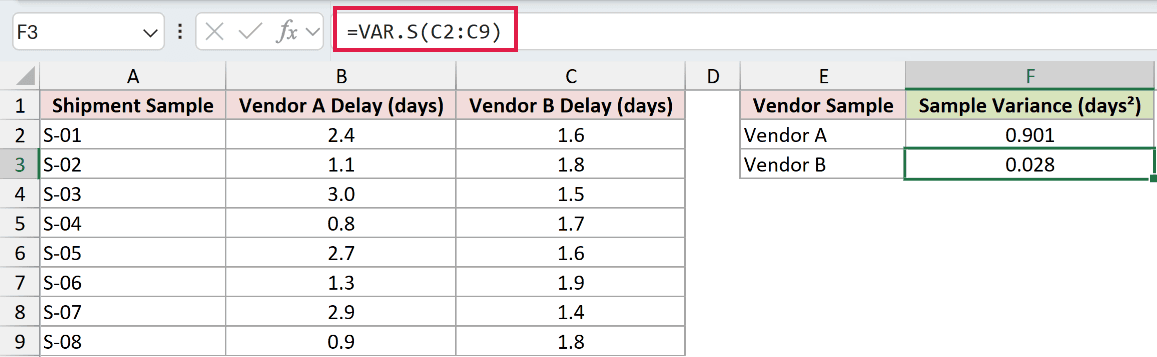
Vendor A returns 0.901 days², while Vendor B returns 0.028 days². The lower sample variance indicates that Vendor B’s sampled delays are more consistent.
Pro Tip: Variance compares consistency, but it does not show which vendor is faster. Compare the sample means alongside the variances before making a decision.
Tips & Common Mistakes
- Use VAR.S for a sample from a larger population. Use VAR.P when your data contains the entire population.
- Confirm the effective sample size with COUNT when a range may contain blanks, logical values, or text.
- VAR.S needs at least two numeric observations. With fewer, n minus 1 is zero and Excel returns
#DIV/0!. - Worksheet errors propagate through VAR.S, so correct them before calculating variance.
- Logical values and numeric text typed directly into the argument list are counted. The same values inside a reference are ignored.
- VAR.S returns one value from a range or array. It does not spill multiple variances by itself.
- Use VAR.S instead of the legacy VAR function in new workbooks.
I covered sample size, n minus 1, squared units, conditional variance, and the link between VAR.S and STDEV.S.
I hope you found this article helpful.
Related Excel Functions / Articles:
Other Excel articles you may also like:
