
Excel’s NORM.S.DIST function returns either the cumulative probability or the probability density for a z-score in the standard normal distribution.
Cumulative results represent areas under the curve, while density results describe the curve’s height at a point. The cumulative argument chooses between them.
In this article, I’ll show you how to convert raw scores to percentiles, calculate tail and interval probabilities, and find a two-tailed p-value.
NORM.S.DIST Function Syntax in Excel
The NORM.S.DIST function uses the following syntax:
=NORM.S.DIST(z,cumulative)
zis the z-score at which you want to evaluate the standard normal distribution.cumulativecontrols the returned value. Use TRUE for the cumulative probability to the left of z, or FALSE for the probability density at z.
When to Use NORM.S.DIST Function
- Convert a z-score into its cumulative probability or estimated percentile.
- Find the share of a normally distributed population above or below a limit.
- Calculate the probability between two z-scores.
- Calculate one-tailed or two-tailed p-values from a z statistic.
- Create density values for plotting a standard normal bell curve.
Example 1: Calculate Cumulative Probability From Z-Scores
Let’s start by turning several z-scores into cumulative probabilities.
Below is the dataset with Z-Score values in A2:A10 and an empty Cumulative Probability column in B2:B10 waiting for the results.
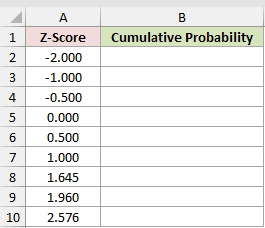
We want to return the area to the left of each z-score with one spilling formula.
Here is the formula:
=NORM.S.DIST(A2:A10,TRUE)
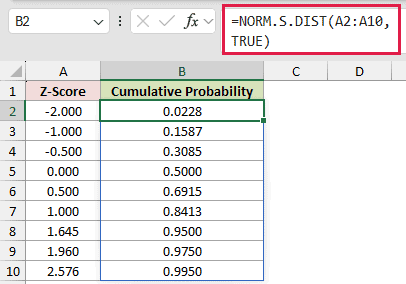
The range A2:A10 supplies all nine z-scores. TRUE tells NORM.S.DIST to return the cumulative area to the left of each value.
For z = -2, the result is 0.0228. At z = 1.96, the cumulative probability is 0.9750.
Pro Tip: This formula spills through B2:B10 in Excel 2021, Excel 2024, and Microsoft 365, so you enter it only in B2.
Example 2: Return Standard Normal Density
Now let’s switch the second argument to FALSE.
Below is the dataset with Z-Score values from -3 to 3 in A2:A14 and an empty Density (Curve Height) column in B2:B14.
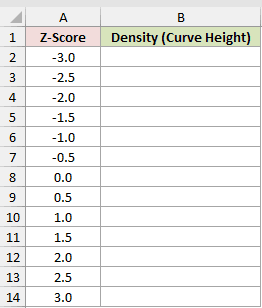
We want to calculate the height of the standard normal curve at each z-score.
Here is the formula:
=NORM.S.DIST(A2:A14,FALSE)
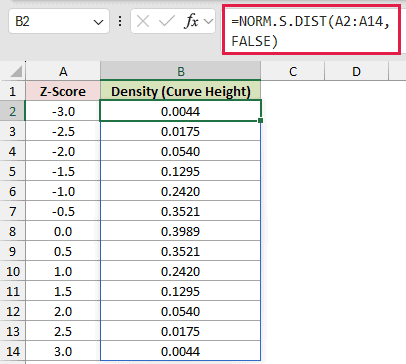
FALSE returns the probability density, or curve height, rather than an accumulated area. At z = -3, the returned density is 0.0044.
The values are symmetric and reach 0.3989 at z = 0. You can use this output as the data for a bell curve chart.
Microsoft’s documentation calls this mode a probability mass function. For a continuous normal distribution, it is a probability density, not a probability.
Example 3: Convert Typing Speeds to Percentiles
Here’s a practical way to work with raw measurements instead of existing z-scores.
Below is the dataset with Candidate, Typing Speed (WPM), empty Z-Score and Estimated Percentile columns, plus a Metric and Value benchmark table.
The table lists Benchmark Mean (WPM) as 52 and Benchmark Std Dev (WPM) as 11.
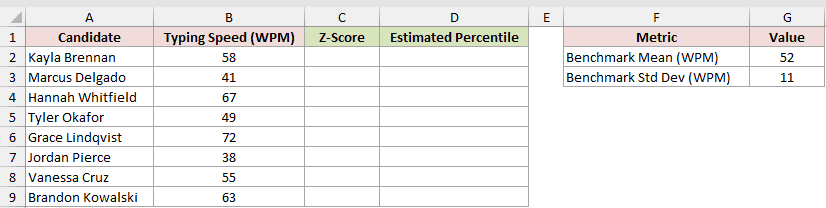
We want to standardize each typing speed and then estimate its percentile under the normal model.
Here is the formula:
=STANDARDIZE(B2:B9,$G$2,$G$3)
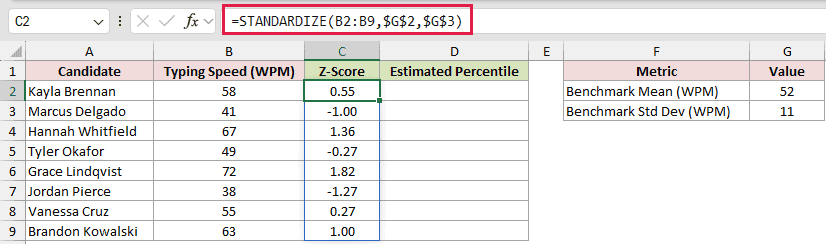
Then use those z-scores to calculate the estimated percentiles:
=NORM.S.DIST(C2:C9,TRUE)
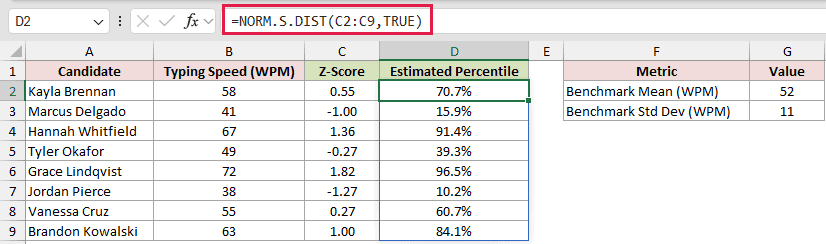
How this formula works:
- STANDARDIZE compares each typing speed in B2:B9 with the benchmark mean in G2 and standard deviation in G3. The absolute references keep those benchmark cells fixed.
- Rounded to two decimal places, Kayla Brennan’s z-score is 0.55.
- NORM.S.DIST returns the cumulative probability for each z-score in C2:C9. The percentage format shows Kayla’s result as an estimated percentile of 70.7%.
Pro Tip: You can skip the separate z-score column with =NORM.DIST(B2:B9,$G$2,$G$3,TRUE). The two-step method still helps when you want to see or reuse each z-score.
Example 4: Calculate Probability Above a Limit
Next, we’ll calculate the share of packages expected to exceed a carrier’s weight limit.
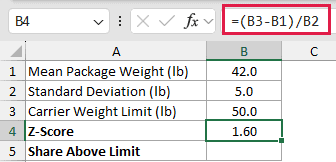
Below is the dataset shown as a parameter card with Mean Package Weight (lb) of 42, Standard Deviation (lb) of 5, and Carrier Weight Limit (lb) of 50.
Its Z-Score and Share Above Limit result cells are empty and waiting for the answers.
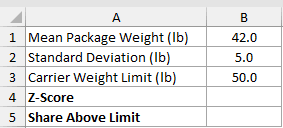
We want to convert the weight limit to a z-score and calculate the right-tail probability above it.
Here is the formula:
=(B3-B1)/B2
Then calculate the share above the limit:
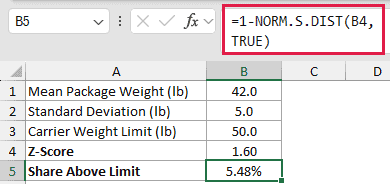
=1-NORM.S.DIST(B4,TRUE)
How this formula works:
- The formula in B4 subtracts the 42 lb mean from the 50 lb limit, then divides by the 5 lb standard deviation. The z-score is 1.60.
- NORM.S.DIST returns the area to the left of 1.60. Subtracting that value from 1 returns the right-tail area, which is 5.48%.
Pro Tip: Because the standard normal distribution is symmetric, =NORM.S.DIST(-B4,TRUE) returns the same right-tail probability.
Example 5: Find Probability Between Z-Scores
Let’s use cumulative probabilities to measure several standard deviation bands.
Below is the dataset with band labels, Lower Z and Upper Z boundaries, and an empty Probability Between column in D2:D6.
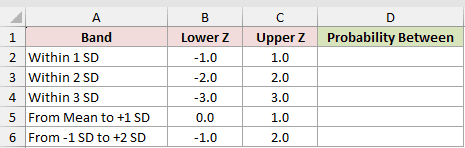
We want to return the probability that a standard normal value falls between each pair of boundaries.
Here is the formula:
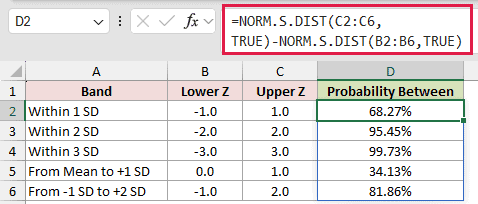
=NORM.S.DIST(C2:C6,TRUE)-NORM.S.DIST(B2:B6,TRUE)
How this formula works:
- The first NORM.S.DIST call returns the cumulative area through each upper z-score in C2:C6.
- The second call returns the area through each lower z-score in B2:B6.
- Subtracting the lower area leaves only the probability between the boundaries. For the -1 to 1 band, the formula returns 68.27%.
The next two rows return 95.45% within two standard deviations and 99.73% within three standard deviations.
Example 6: Calculate a Two-Tailed Z-Test p-Value
Finally, here’s a two-tailed test using a known population standard deviation.
Below is the dataset shown as a parameter card with Sample Mean Fill (mL) of 498.6, Target Fill (mL) of 500, and Known Std Dev (mL) of 4.
It also shows a Sample Size of 36, with empty Z Statistic and Two-Tailed p-Value result cells waiting for the answers.
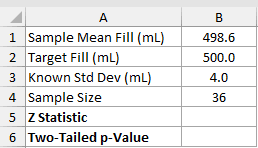
We want to calculate the z statistic for the bottling sample and then return its two-tailed p-value.
Here is the formula:
=(B1-B2)/(B3/SQRT(B4))
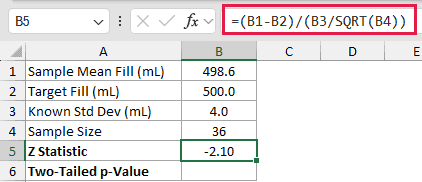
Then calculate the two-tailed p-value:
=2*(1-NORM.S.DIST(ABS(B5),TRUE))
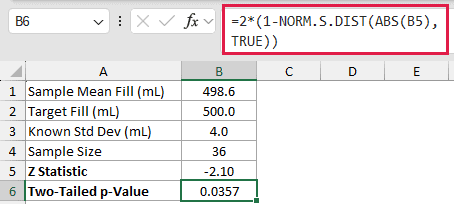
How this formula works:
- The formula in B5 divides the difference between the 498.6 mL sample mean and 500 mL target by the standard error. The displayed z statistic is -2.10.
- ABS converts the z statistic to its positive magnitude. NORM.S.DIST returns the cumulative area to the left of +2.10, and subtracting from 1 leaves the upper tail of 0.0179.
- Multiplying by 2 includes both tails. The two-tailed p-value is 0.0357.
For a one-tailed left test, the p-value is 0.0179. That value belongs to the lower tail because the sample mean is below the target.
Tips & Common Mistakes
- Range formulas spill automatically in Excel 2021, Excel 2024, and Microsoft 365. Excel 2019 and earlier need one formula per row or a formula entered with Ctrl+Shift+Enter.
- A blocked output range causes a
#SPILL!error. Clear the cells where the results need to appear. - An
@before NORM.S.DIST applies implicit intersection and reduces a range calculation to one result. Remove it when you want the full spill. - The NORM.DIST function produces the same result when its mean is 0 and standard deviation is 1. Its equivalent syntax is
NORM.DIST(z,0,1,cumulative). - The legacy
NORMSDIST(z)function has nocumulativeargument and returns only the cumulative value. - The NORM.S.INV function for critical values finds z from a cumulative probability.
NORM.S.INV(0.975)returns about 1.96, with an exact value of 1.959963985, so the reversal of Example 1 is approximate. - Do not use
1-NORM.S.DIST(z,FALSE)for a tail probability. FALSE returns a density, so subtracting it from 1 does not produce an area. - A text value supplied as z makes NORM.S.DIST return
#VALUE!.
I showed how NORM.S.DIST turns z-scores into cumulative probabilities or curve heights, then used those results in several practical examples.
I hope you found this article helpful.
Related Excel Functions / Articles:
