
Excel’s POISSON.DIST function returns the probability of a specific event count or the cumulative probability of that count or fewer, using an expected average.
It works well for counts within a fixed interval, such as walk-ins per hour, orders per 30 minutes, or support tickets per day.
I’ll show you how to compare at least versus more than a goal, build a planning threshold without POISSON.INV, and flag unusually busy days.
POISSON.DIST Function Syntax in Excel
The POISSON.DIST function takes an event count, an expected average, and a cumulative setting.
=POISSON.DIST(x, mean, cumulative)
- x (required) is the number of events you want to evaluate. Excel truncates a decimal x to an integer.
- mean (required) is the expected number of events for the same interval.
- cumulative (required) controls the returned probability. Use FALSE for exactly x events or TRUE for x events or fewer.
When to Use POISSON.DIST Function
- Find the probability of exactly a certain number of arrivals, calls, orders, or defects within a fixed interval.
- Calculate the chance of an event count being at most, at least, or more than a target.
- Measure the probability that a count falls between two inclusive limits.
- Scale an average rate to a shorter interval and estimate the chance of no events.
- Set a planning threshold or flag an unusually high observed count.
Example 1: Exact and Cumulative Poisson Probabilities
Let’s start with exact and cumulative probabilities in one table.
Below is the dataset. Column A lists 0 through 12 walk-ins, columns B and C have green result headers with empty cells, and E2 stores the hourly average.
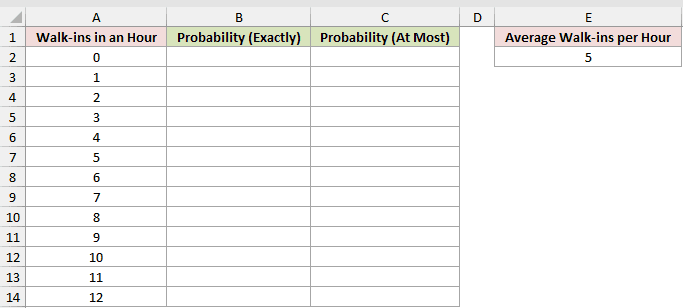
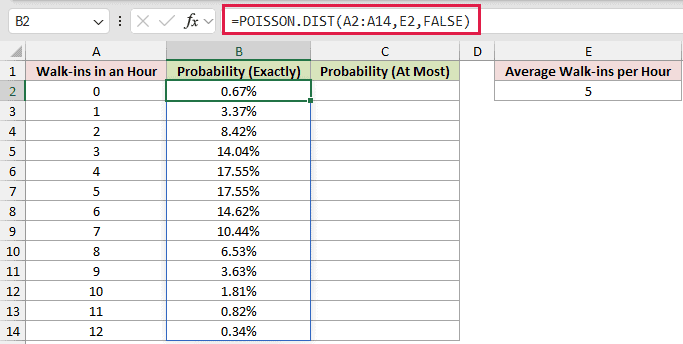
Column B should return the probability of each exact count.
Here is the formula entered in B2, which spills through B14:
=POISSON.DIST(A2:A14,E2,FALSE)
Column C should return the probability of each count or fewer.
Here is the formula entered in C2, which spills through C14:
=POISSON.DIST(A2:A14,E2,TRUE)
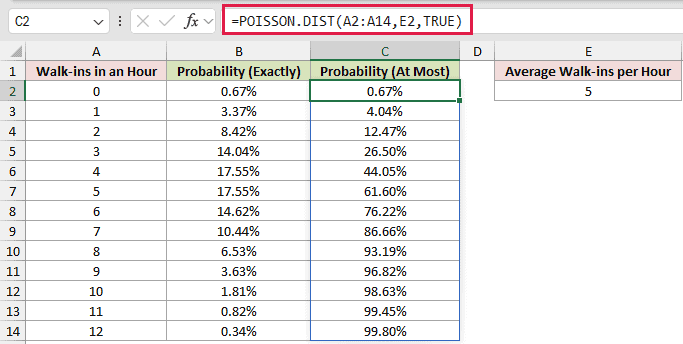
The FALSE formula returns one exact-count probability. The TRUE formula adds the probabilities from zero through the count in column A.
At two walk-ins, the exact probability is 8.42%, while the probability of two or fewer is 12.47%.
These range-based formulas spill in Excel 2021, Excel 2024, and Microsoft 365. Excel 2019 and earlier require a formula in each row.
Pro Tip: Keep the cells below each formula empty. Anything blocking the output range causes a #SPILL! error.
Example 2: At Least Versus More Than
Let’s compare the chance of reaching a goal with the chance of exceeding it.
Below is the dataset. Column A lists daily goals, columns B and C have green headers with empty result cells, and E2 holds the average of 12.
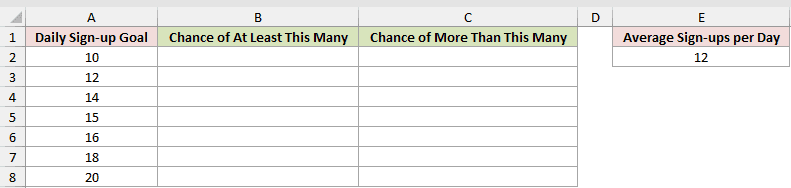
Column B should return the chance of meeting or exceeding each goal.
Here is the formula entered in B2, which spills through B8:
=1-POISSON.DIST(A2:A8-1,E2,TRUE)
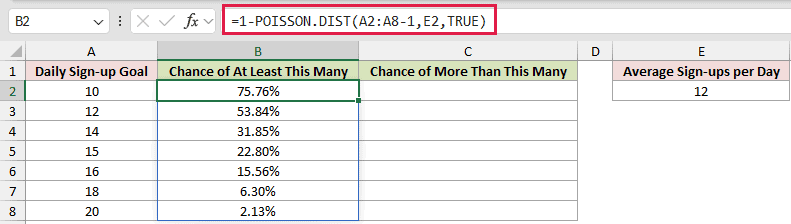
Column C should return the chance of exceeding each goal.
Here is the formula entered in C2, which spills through C8:
=1-POISSON.DIST(A2:A8,E2,TRUE)
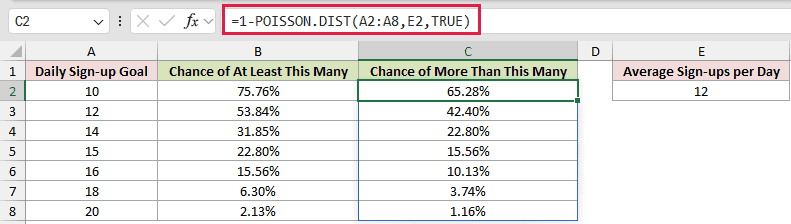
At least k excludes counts through k minus 1. More than k excludes counts through k itself.
For a goal of 15, the chance of at least 15 sign-ups is 22.80%. The chance of more than 15 is 15.56%.
That one-count shift matters whenever the target count itself should be included.
Example 3: Probability Between Two Event Counts
Now let’s calculate the chance of landing inside an inclusive range.
Below is the dataset. Column A lists the kitchen-load bands, while columns B and C contain the minimum and maximum orders.
Column D has a green header with empty result cells. F2 stores the average of 11 orders per 30 minutes.
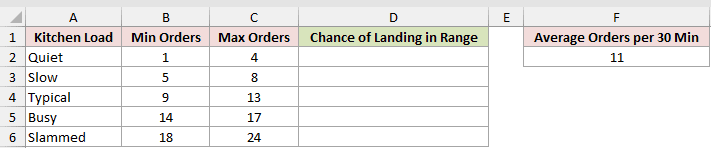
Column D should return the probability that orders fall between each minimum and maximum.
Here is the formula entered in D2, which spills through D6:
=POISSON.DIST(C2:C6,F2,TRUE)-POISSON.DIST(B2:B6-1,F2,TRUE)
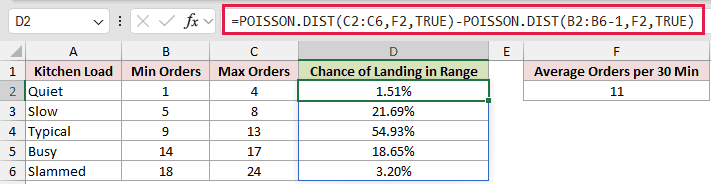
The first POISSON.DIST call includes every count through the maximum. The second removes every count below the minimum.
The Typical band, from 9 through 13 orders, returns 54.93%.
Pro Tip: If the range starts at zero, use =POISSON.DIST(max,mean,TRUE). Subtracting one from zero would pass a negative x and return #NUM!.
Example 4: Scale the Mean to Another Interval
This example converts an hourly average before calculating the probability.
Below is the dataset. Column A lists time intervals, columns B and C have green headers with empty result cells, and E2 stores the hourly average.
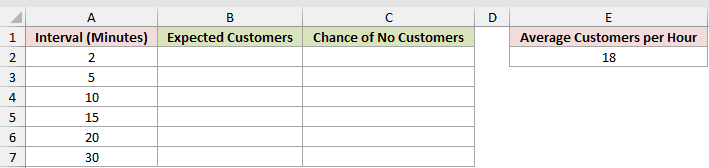
Column B should return the expected customers for each shorter interval.
Here is the formula entered in B2, which spills through B7:
=E2*A2:A7/60
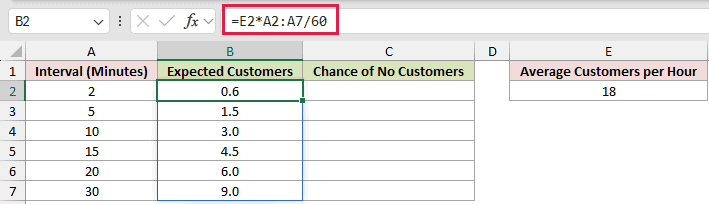
Column C should return the chance of no customers during each interval.
Here is the formula entered in C2, which spills through C7:
=POISSON.DIST(0,B2:B7,FALSE)
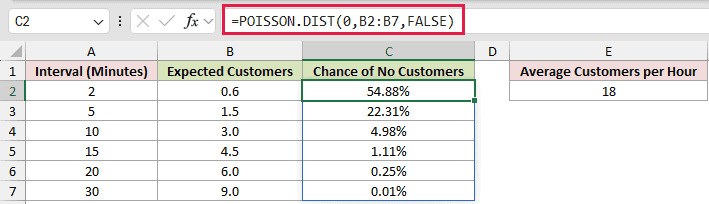
The first formula converts 18 customers per hour into an expected count for each interval. A 10-minute interval has an expected count of 3.0.
The second formula evaluates exactly zero customers using those scaled means. For 10 minutes, the probability is 4.98%.
The mean must always use the same interval as the count being evaluated.
Example 5: Find a Poisson Planning Threshold
Here’s a practical way to plan capacity around a service target.
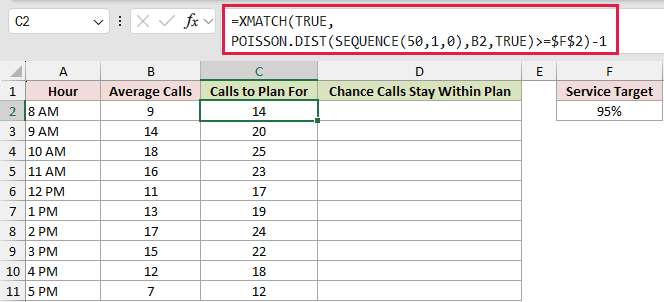
Below is the dataset. Columns A and B contain hourly call data, C and D have green headers with empty result cells, and F2 contains the 95% target.
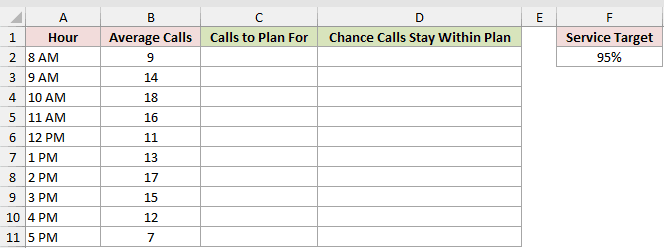
Column C should find the smallest call count whose cumulative probability reaches the target.
Here is the formula entered in C2 and copied down through C11:
=XMATCH(TRUE,POISSON.DIST(SEQUENCE(50,1,0),B2,TRUE)>=$F$2)-1
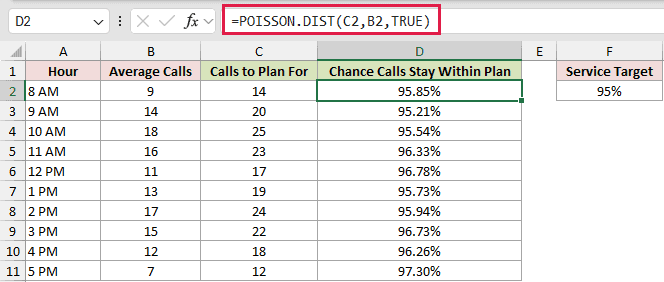
Column D should check the cumulative probability at each selected count.
Here is the formula entered in D2 and copied down through D11:
=POISSON.DIST(C2,B2,TRUE)
SEQUENCE produces candidate counts from 0 through 49.
POISSON.DIST tests their cumulative probabilities. XMATCH returns the position of the first TRUE, the first candidate whose cumulative probability is at least the target in F2.
Subtracting 1 turns that 1-based position into the call count because the candidates start at 0.
For larger averages, increase the 50 in SEQUENCE. Otherwise, XMATCH may find no match and return #N/A.
At 8 AM, the formula selects 14 calls. The check formula returns 95.85%, confirming that the selected count clears the 95% target.
Each row uses its own hourly average, so these formulas are copied down instead of spilled as one range calculation.
This method requires Excel 2021, Excel 2024, or Microsoft 365. Excel has no POISSON.INV function.
Example 6: Flag Unusually High Daily Counts
Let’s use a tail probability to flag unusually busy help-desk days.
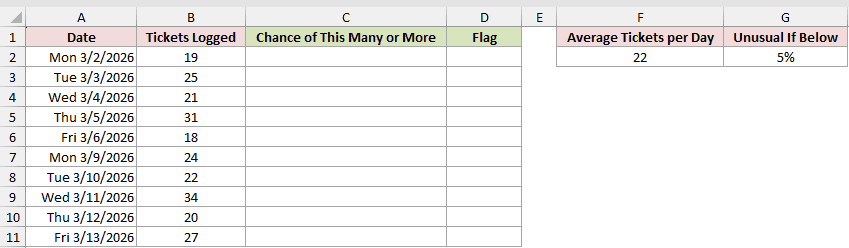
Below is the dataset. Columns A and B hold dates and ticket counts, C and D have green headers with empty cells, and F2:G2 store the average and threshold.
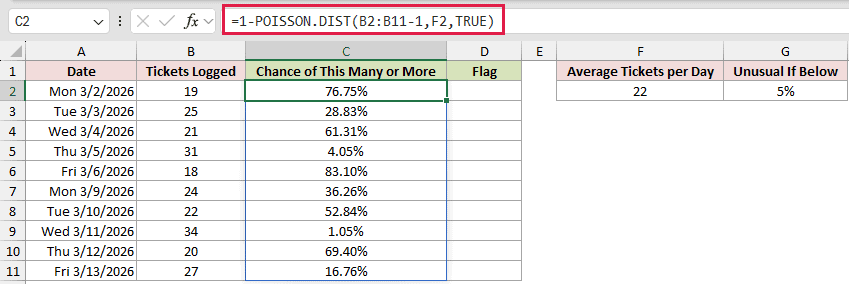
Column C should return the chance of seeing each ticket count or more.
Here is the formula entered in C2, which spills through C11:
=1-POISSON.DIST(B2:B11-1,F2,TRUE)
Column D should compare each probability with the 5% threshold.
Here is the formula entered in D2, which spills through D11:
=IF(C2:C11<G2,"Unusual","Normal")
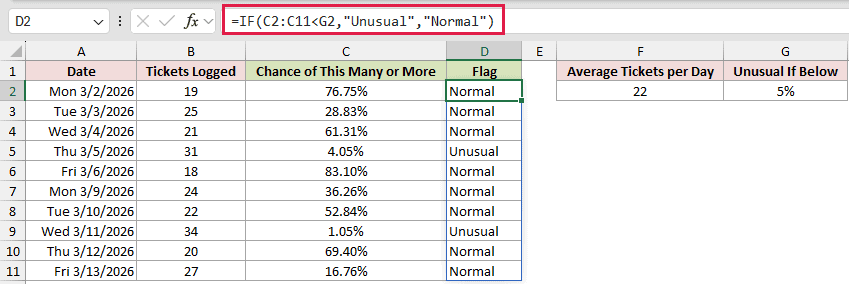
The first formula calculates the upper-tail probability for each observed count. The IF formula labels probabilities below 5% as Unusual.
The days with 31 and 34 tickets return 4.05% and 1.05%, so both are flagged as Unusual.
Treat this flag as a practical monitoring rule. It isn’t a formal statistical test.
F2 sets the daily average at 22 tickets, while G2 sets the cutoff at 5%.
Example 7: Test POISSON.DIST Input Rules
The last example shows how Excel handles several boundary inputs.
Below is the dataset. Columns A through C list each scenario, event count, and mean. Column D has a green header with empty result cells.
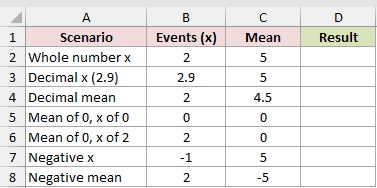
Column D should return each exact probability or the expected Excel error.
Here is the formula entered in D2, which spills through D8:
=POISSON.DIST(B2:B8,C2:C8,FALSE)
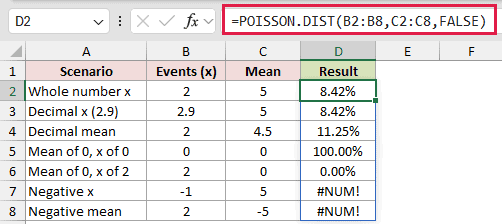
Excel truncates an x of 2.9 to 2, so both rows return 8.42%. A decimal mean is valid and returns 11.25% in this table.
A mean of zero returns 100.00% when x is zero and 0.00% when x is two.
A negative x or negative mean returns #NUM!.
Tips & Common Mistakes
- TRUE includes x itself. For fewer than x, use
POISSON.DIST(x-1,mean,TRUE). - At least x uses x minus 1 inside the cumulative calculation. More than x uses x itself.
- You can’t use an hourly mean directly with a 10-minute count. Convert the mean to the 10-minute interval first, as Example 4 does.
- POISSON.DIST assumes independent events occurring at a steady average rate. Separate periods with clearly different rates instead of blending them into one mean.
- Excel truncates decimal x values instead of rounding them. Use ROUNDUP first when a calculated threshold must move to the next whole count.
- A negative x or mean returns
#NUM!. - In Excel 2021, Excel 2024, and Microsoft 365, range inputs can spill. A leading
@limits the formula to one result. - Excel 2019 and earlier require formulas entered by row. Keep the mean reference absolute when copying them down.
- The older POISSON function uses the same arguments, but POISSON.DIST is the current function name.
- POISSON.DIST models counts within an interval. EXPON.DIST is used for time between events.
When you’re finding the probability of at least x, use x minus 1 so the boundary count stays included.
Match the mean to the same interval as the event count before you calculate the probability.
Other Excel articles you may also like:
