
Excel’s ERFC function returns the complementary error function, integrated from a given value to infinity. Mathematically, it equals one minus the error function, ERF.
With the right scaling, ERFC calculates normal-distribution tail probabilities. That makes it useful for estimating the share of packages exceeding a weight limit or products missing a minimum rating.
In this article, I’ll show you how to calculate shares outside process limits, handle upper and lower thresholds, and find two-tailed p-values from z statistics.
ERFC Function Syntax in Excel
The ERFC function takes one required argument:
=ERFC(x)
- x: The numeric lower limit for the complementary error-function integral. You can enter a number or reference a cell containing one.
When to Use ERFC Function
- Calculate the complementary error function for a numeric input.
- Estimate the share of a normally distributed process outside symmetric limits, then convert that share to units per million.
- Find the probability that a normally distributed measurement exceeds an upper limit or falls below a minimum.
- Convert a z statistic into a two-tailed p-value for a hypothesis test.
Example 1: Calculate ERFC and Compare with ERF
Let’s start by seeing how ERFC changes as its input increases.
Below is the dataset with inputs in A2:A11 and empty result cells under ERFC Result and 1 – ERF Check.
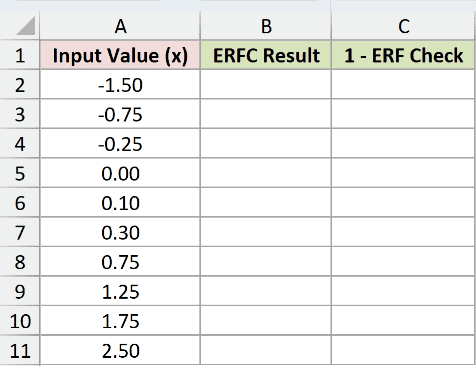
I want to calculate ERFC for each input, then compare it with one minus ERF.
Here is the formula:
=ERFC(A2)
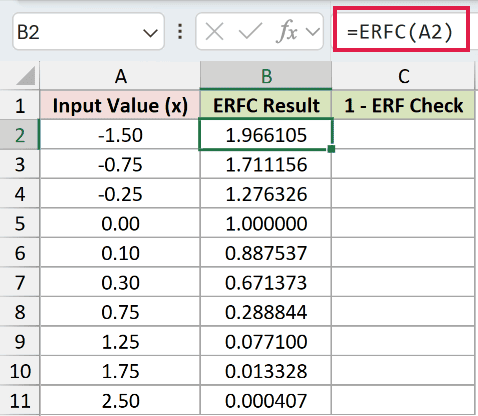
Enter it in B2 and fill down to B11. For the input -1.50 in A2, the result displays as 1.966105.
For the comparison, enter this formula in C2 and fill down to C11:
=1-ERF(A2)
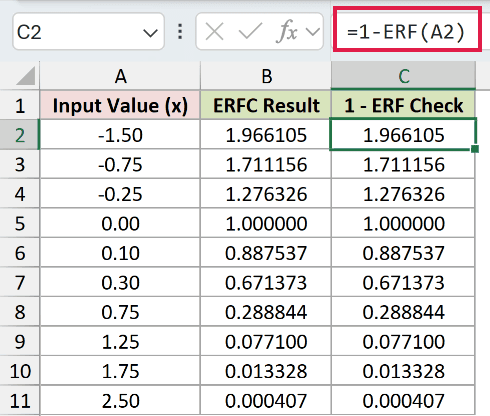
Both columns display the same six-decimal results. At zero, ERFC returns 1.000000. At 0.75, it displays 0.288844, and at 2.50, it displays 0.000407.
ERFC approaches zero as positive inputs increase. Negative inputs return values above one, approaching two as the inputs become more negative.
Pro Tip: A raw ERFC result is not automatically a probability. Negative inputs can return values above 1. The following examples apply the scaling needed for normal-distribution probabilities.
Example 2: Estimate Units Outside Process Limits
Now let’s turn ERFC into an estimate of units outside a process’s limits.
Below is the dataset with six processes, their Sigma Level Achieved, and empty columns for Share Outside Limits and Out-of-Limit Units per Million.
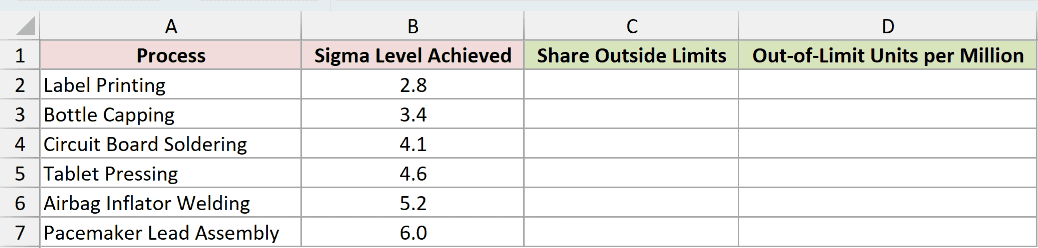
I want to estimate the share outside both limits for each centered, normally distributed process.
Here is the formula:
=ERFC(B2/SQRT(2))
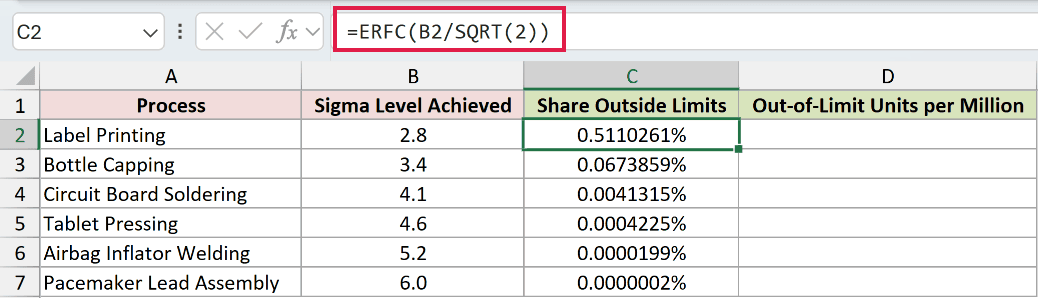
Enter it in C2 and fill down to C7. Label Printing, at 2.8 standard deviations on either side of the mean, displays 0.5110261% outside the limits.
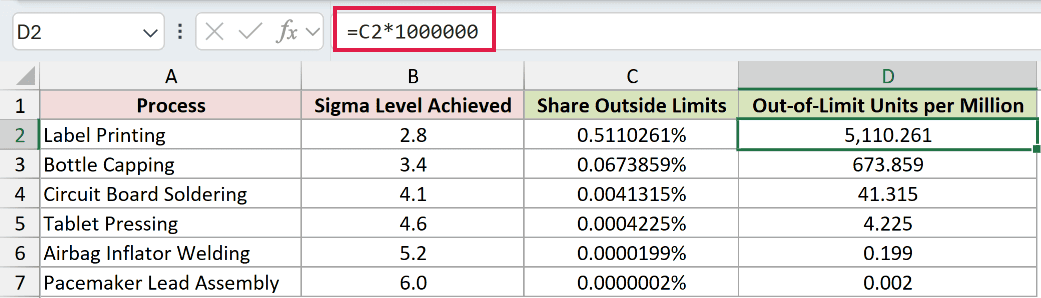
To express that share as units per million, enter this formula in D2 and fill down to D7:
=C2*1000000
How this formula works:
B2contains the distance from the mean to either limit, measured in standard deviations.- Dividing by
SQRT(2)converts that distance to ERFC’s input scale. The error-function curve and standard normal curve use different scaling. - ERFC returns the combined share in both tails, outside the symmetric limits.
- Multiplying C2 by 1,000,000 converts the probability into an expected count per million units.
Label Printing displays 5,110.261 units per million. Circuit Board Soldering displays 41.315, while Pacemaker Lead Assembly displays 0.002.
Pro Tip: These estimates assume a normal distribution centered between symmetric limits. They apply no 1.5-sigma shift, so do not interpret them as conventional shifted Six Sigma DPMO figures.
Example 3: Calculate the Share Above a Limit
Sometimes only the upper tail matters, such as packages exceeding a carrier’s weight limit.
Below is the dataset with package types, mean weights, standard deviations, carrier limits, and empty Share Over Limit cells in E2:E7.
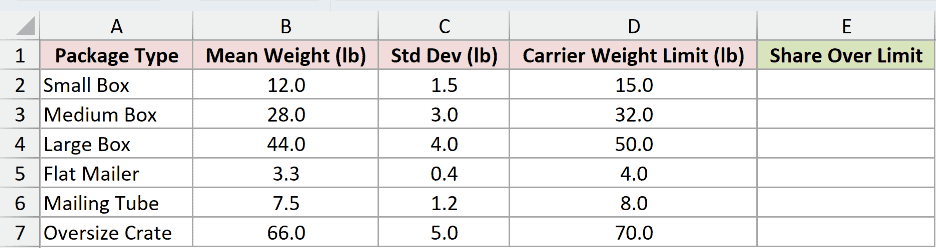
I want to estimate the share of each package type exceeding its carrier limit, assuming normally distributed weights.
Here is the formula:
=ERFC((D2-B2)/(C2*SQRT(2)))/2
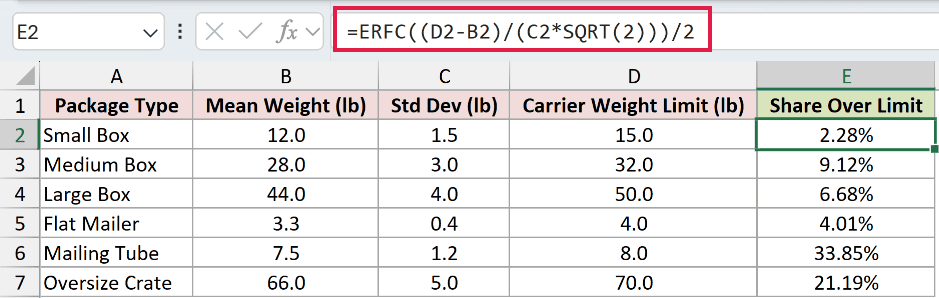
Enter it in E2 and fill down to E7.
How this formula works:
D2-B2subtracts the 12-pound mean from the 15-pound limit, leaving 3 pounds.- Dividing by the 1.5-pound standard deviation in C2 places the limit two standard deviations above the mean.
SQRT(2)supplies the same ERFC scaling used in Example 2.- Dividing ERFC’s result by 2 returns the upper-tail probability for this standardized threshold.
Small Box displays 2.28% over the limit. Mailing Tube displays 33.85%, reflecting how close its 8-pound limit sits to its 7.5-pound mean.
Pro Tip: Keep the final division by 2 when calculating one tail. Example 2 needed both tails, so its formula did not include that division.
Example 4: Calculate the Share Below a Minimum
For a minimum requirement, we need the lower tail instead.
Below is the dataset with battery models, mean runtimes, standard deviations, rated minimums, and empty Share Below Minimum cells in E2:E7.
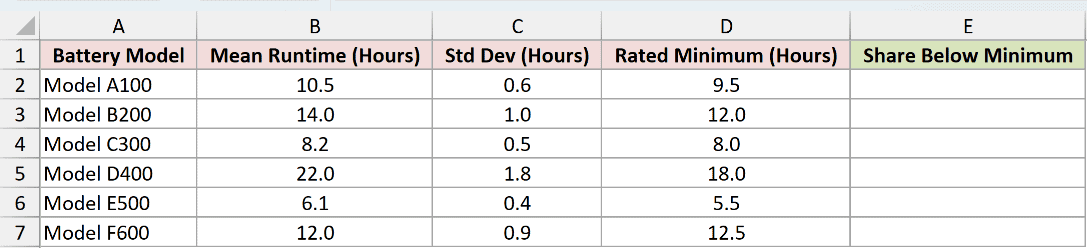
I want to estimate the share of batteries falling short of their rated runtime, assuming normally distributed runtimes.
Here is the formula:
=ERFC((B2-D2)/(C2*SQRT(2)))/2
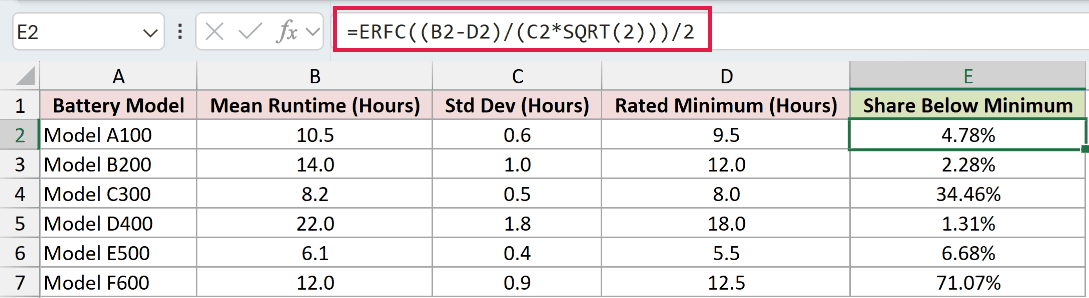
Enter it in E2 and fill down to E7.
How this formula works:
B2-D2subtracts the 9.5-hour minimum from the 10.5-hour mean, giving 1 hour.- Dividing by
C2*SQRT(2)adjusts that gap for the 0.6-hour standard deviation and ERFC’s scale. - Reversing the subtraction from Example 3 selects the lower tail. The final division by 2 converts it to a one-sided probability.
Model A100 displays 4.78% below its minimum. Model D400 displays 1.31%, while Model F600 displays 71.07%.
Model F600’s mean runtime is 12 hours, below its 12.5-hour rated minimum. More than half the modeled runtimes therefore fall short.
Pro Tip: Check the subtraction order before filling down. For the upper tail, subtract mean from limit. For the lower tail, subtract limit from mean.
Example 5: Find Two-Tailed p-Values with ERFC
ERFC also converts a z statistic into a two-tailed p-value.
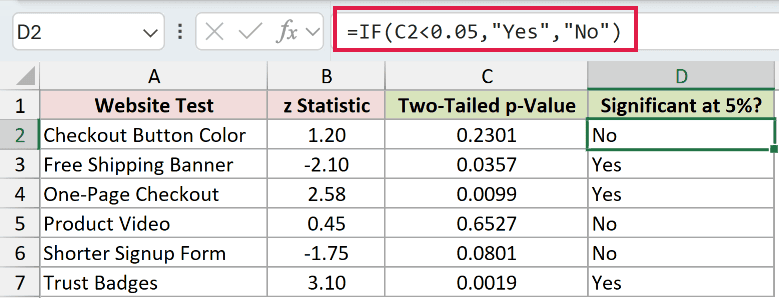
Below is the dataset with website tests, z statistics, and empty Two-Tailed p-Value and Significant at 5%? columns.
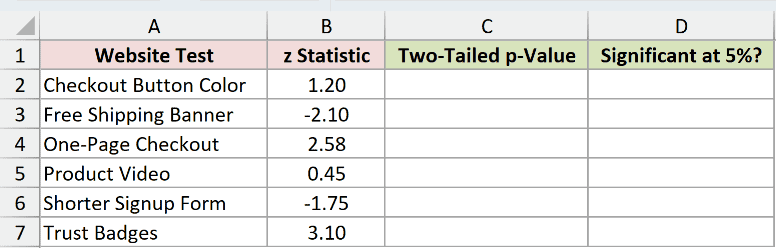
I want to calculate each test’s two-tailed p-value and flag values below 0.05.
Here is the formula:
=ERFC(ABS(B2)/SQRT(2))
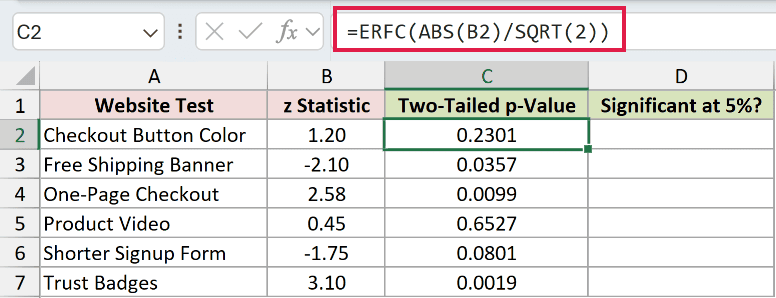
Enter it in C2 and fill down to C7. Checkout Button Color, with a z statistic of 1.20, displays a p-value of 0.2301.
To add the significance flag, enter this formula in D2 and fill down to D7:
=IF(C2<0.05,"Yes","No")
How this formula works:
ABS(B2)removes the sign because a two-tailed test considers departures in either direction.- Dividing by
SQRT(2)scales the absolute z statistic for ERFC. - ERFC returns the combined probability of results at least that far from zero in either direction, under the standard normal null distribution.
- IF returns Yes when the p-value is below 0.05 and No otherwise. It compares the underlying value, not its rounded display.
Free Shipping Banner has a z statistic of -2.10 and displays 0.0357, so its flag is Yes. Checkout Button Color displays No.
One-Page Checkout and Trust Badges also display Yes. Product Video and Shorter Signup Form display No.
Pro Tip: This calculation requires a z statistic with a standard normal null distribution. Do not substitute a t statistic. The flags apply a separate, unadjusted 5% cutoff to each test.
Tips & Common Mistakes
- ERFC needs a numeric input. If you give it nonnumeric text, it returns
#VALUE!. - Passing A2:A11 directly to ERFC produces one
#VALUE!rather than spilling results. In the examples, each formula references one cell and is filled down. - The unary plus in
=ERFC(+A2:A11)converts the range into an array so the results spill. Dynamic arrays are available in Excel 2021, Excel 2024, and Microsoft 365. Leave the output area empty; in older versions, fill down. - You can use negative inputs in Excel 2010 and later. In Excel 2007, they return
#NUM!. - A small tail probability may look like zero if you show too few decimal places. Example 2 displays percentages with seven decimal places so you can see even its smallest share.
- For very small tails, subtracting an ERF result close to one from one can lose precision. ERFC calculates the complement directly, avoiding that subtraction.
- You can keep using ERFC for these examples. ERFC.PRECISE computes the same complementary error function.
- These probability calculations assume normally distributed data and positive standard deviations. Check that those assumptions fit your data, since ERFC does not check them for you.
In this article, I showed you how ERFC compares with ERF and how to use it for process limits, upper and lower thresholds, and two-tailed p-values.
I hope you found this article helpful.
Other Excel articles you may also like:
