
Excel’s BINOM.DIST function returns the probability of a specific number of successes in a fixed number of independent trials.
It can calculate an exact outcome or the cumulative probability of outcomes up to a chosen limit. Each trial must have the same success probability.
The question’s wording matters. “Exactly” maps to FALSE, while minimum targets use the TRUE result one below the target.
BINOM.DIST Function Syntax in Excel
Use this syntax with all four required arguments:
=BINOM.DIST(number_s,trials,probability_s,cumulative)
number_s: The number of successes whose probability you want to calculate.trials: The total number of independent trials.probability_s: The probability of success in each trial, entered as a value from 0 to 1.cumulative: UseFALSEfor exactlynumber_ssuccesses. UseTRUEfor at mostnumber_ssuccesses.
When to Use BINOM.DIST Function
- Calculate the chance of an exact number of responses, sales, defects, or other outcomes.
- Find the probability of staying at or below an allowed limit.
- Measure the chance of reaching a minimum target by subtracting a cumulative result from 1.
- Compare probabilities across several success rates, trial counts, or target values.
Example 1: Exact Binomial Probabilities for Every Outcome
Let’s start by calculating the probability of every possible email result.
Below is the dataset with Opens from 0 through 10, an empty Exact Probability column, and inputs for 10 emails with a 30% open rate.
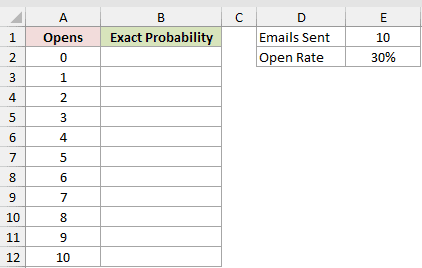
We want to calculate the exact probability of getting each possible number of opens.
Here is the formula:
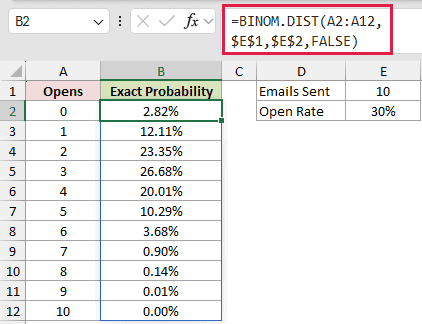
=BINOM.DIST(A2:A12,$E$1,$E$2,FALSE)
How this formula works:
A2:A12supplies every possible open count, from 0 through 10.$E$1fixes the number of trials at 10 emails.$E$2fixes the success probability at the 30% open rate.FALSEasks for the probability of each exact number of opens.
Entered in B2, the formula spills through B12. The first result is 2.82% for zero opens, while three opens has the highest probability at 26.68%.
The 10-opens result displays as 0.00%, but its underlying probability is about 0.0000059. Together, the probabilities in the column total 100%.
The calculation accounts for the possible combinations that can produce each exact number of opens.
This spilling formula works in Excel 2021, Excel 2024, and Microsoft 365.
Pro Tip: In Excel 2021 and later, the SEQUENCE function can generate the complete Opens column with =SEQUENCE(E1+1,,0).
Example 2: Probability of Staying Within a Limit
Here’s a simple way to check an allowed maximum.
Below is the dataset showing 25 deliveries, an 8% late rate, a limit of 2, and an empty Probability Within Limit cell.
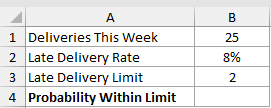
We want to calculate the probability that no more than two deliveries are late.
Here is the formula:
=BINOM.DIST(B3,B1,B2,TRUE)
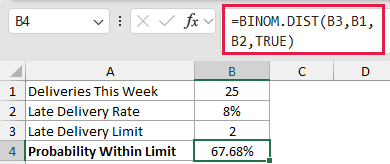
With cumulative set to TRUE, BINOM.DIST adds the probabilities for zero, one, and two late deliveries. Cell B4 returns 67.68%.
Pro Tip: A different question, fewer than 2 late deliveries, uses =BINOM.DIST(B3-1,B1,B2,TRUE) and returns 39.47%.
Example 3: Probability of Hitting a Minimum Quota
Now let’s calculate an at-least probability for several people at once.
Below is the dataset with each sales rep’s demos, close rate, and deal quota. The Chance of Hitting Quota column is empty before the formula is entered.
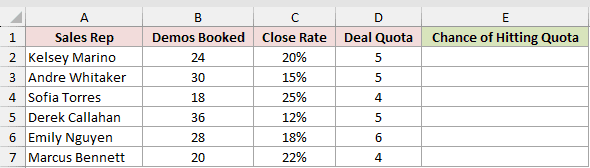
We want to calculate each rep’s probability of closing at least the number of deals in their quota.
Here is the formula:
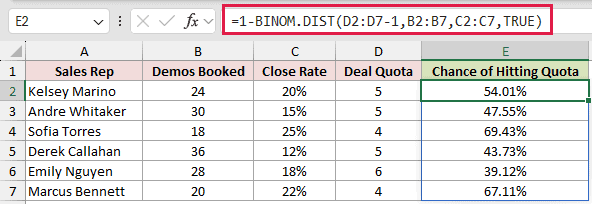
=1-BINOM.DIST(D2:D7-1,B2:B7,C2:C7,TRUE)
How this formula works:
D2:D7-1sets each cumulative cutoff one deal below the quota.BINOM.DIST(...,TRUE)returns the probability of finishing below the quota.- Subtracting that result from 1 leaves the probability of meeting or exceeding the quota.
- The aligned ranges use each rep’s demos, close rate, and quota, then spill the results from E2 through E7.
Cell E2 returns 54.01% for Kelsey Marino. Sofia Torres is highest at 69.43% in E4, while Emily Nguyen is lowest at 39.12% in E6.
In newer versions of Excel, BINOM.DIST.RANGE(trials,probability_s,number_s,trials) answers the same at-least question directly. The complement formula used here makes the adjusted cutoff easy to see.
This at-least result can serve as a one-sided p-value when testing whether a count this high is unusual under the assumed success rate.
Pro Tip: At least 5 uses D2-1, while more than 5 uses D2. For Kelsey Marino, those probabilities are 54.01% and 34.41%.
Example 4: Binomial Probability Between Two Values
This example adds both a lower and an upper boundary.
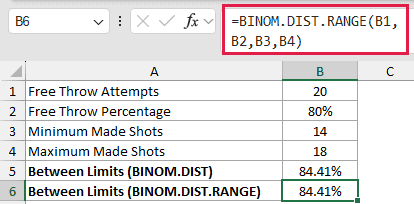
Below is the dataset with 20 attempts, an 80% free throw percentage, limits of 14 and 18, and two labeled result cells.
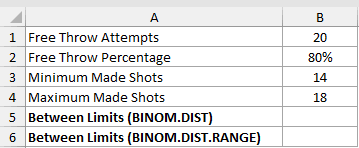
We want to calculate the probability of making between 14 and 18 free throws, including both limits.
Here is the formula:
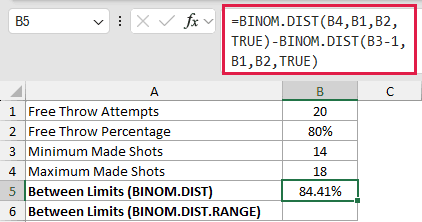
=BINOM.DIST(B4,B1,B2,TRUE)-BINOM.DIST(B3-1,B1,B2,TRUE)
BINOM.DIST.RANGE offers a shorter formula for the same inclusive interval in newer Excel versions:
=BINOM.DIST.RANGE(B1,B2,B3,B4)
How these formulas work:
- The first BINOM.DIST returns the cumulative probability of making at most 18 shots.
- The second BINOM.DIST uses
B3-1to return the probability of making at most 13 shots. - Subtracting removes outcomes below 14, leaving the inclusive range from 14 through 18.
- BINOM.DIST.RANGE places trials and probability first, followed by the lower and upper success counts.
Both formulas return 84.41%. The first shows the cumulative subtraction, while BINOM.DIST.RANGE expresses the inclusive interval in one function.
Pro Tip: Keep the -1 on the lower boundary. Using B3 instead of B3-1 excludes 14 made shots and returns 73.50% instead of 84.41%.
Example 5: Compare Batch Acceptance Probabilities
Finally, let’s use one rule across several defect-rate scenarios.
Below is the dataset with defect rates from 1% through 10%, an empty Chance of Accepting Batch column, and inputs for a 50-item sample allowing one defect.
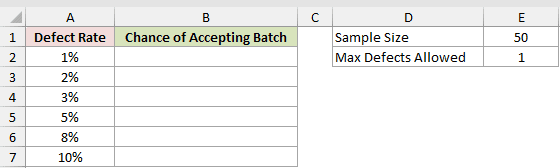
We want to calculate the probability of accepting the batch at each defect rate.
Here is the formula:
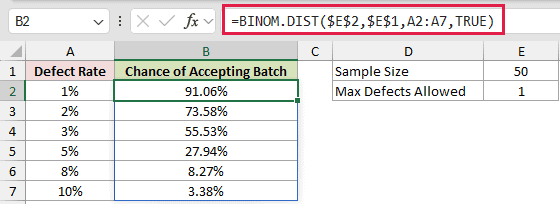
=BINOM.DIST($E$2,$E$1,A2:A7,TRUE)
How this formula works:
$E$2sets the maximum allowed defects to 1.$E$1fixes the sample size at 50 items.A2:A7supplies each defect rate as the success probability. Here, a defect is the event being counted.TRUEincludes both zero and one defect, and the results spill down the empty column.
At a 1% defect rate, the first result is 91.06%. At a 10% defect rate, the chance of accepting the batch falls to 3.38%.
Tips & Common Mistakes
- BINOM.DIST assumes a fixed number of independent trials, two possible outcomes per trial, and a constant success probability.
- Excel truncates
number_sto an integer, so 2.9 is treated as 2. For an at-least target, round a calculated minimum up first. At-most limits should remain truncated. - Excel returns a #NUM! error when successes exceed trials or the probability is outside 0 to 1. Enter 80% as
80%or0.8, not80. - For at least
ksuccesses, subtract the cumulative probability atk-1from 1. For fewer thank, usek-1as the cumulative cutoff. - Keep the destination cells clear for spilling formulas. Blocked cells can cause a
#SPILL!error. - Range formulas spill in Excel 2021, Excel 2024, and Microsoft 365. Excel 2019 and earlier need one formula per row or a Ctrl+Shift+Enter array formula.
- Use BINOM.DIST instead of the legacy BINOMDIST function. BINOM.INV finds the smallest success count for a target cumulative probability. For continuous outcomes, the NORM.DIST function is the closer counterpart.
I’ve covered how BINOM.DIST handles exactly, at most, at least, and between questions, including the cutoff adjustments needed for cumulative calculations.
I hope you found this article helpful.
Related Excel Functions / Articles:
